SDoH analytics requires a lot of data, and different types of data. Claims data tells us about health care visits. Digital device data tells us about daily health. And special data sets let us delineate the social and environmental factors that could influence each member.
In SDoH analytics, we understand each person as an individual and in context, but look at a community as a whole in aggregate, to see what trends and patterns emerge.

Here are 5 important aspects to consider, and tips of what to look for, so you can trust the insights in your SDoH analytic endeavors.
Wellness means care and lifestyle choices. This data is scattered across many different places. Health analytics must integrate complex claims data structures and lifestyle data at an individual person level. SDoH analytics should also be connected at a person level. This way, the data is ready to serve all the analytic questions you may ask, without additional data preparation and delays.

The more granular a data set is, and assuming it is associated at a member-specific level, the more trustworthy and usable your SDoH insights will be. Think about the variation of social and environmental factors you see across an entire zip code. Now think about the degree of variation you see within a neighborhood. A Census Block Group is akin to a neighborhood. This means if you have source data that has a Census Block Group level of granularity, you are seeing only the degree of variation across neighborhoods, not entire zip codes.

Social and environmental factors cover a broad range of influences on health. Air quality or water quality? Economic hardship or transportation access? There is so much we can do if we have lots of different SDoH indices to choose from. For instance, one HDMS client is looing at the transporation index alongside the technology index to assess the potential usefulness and impact of a mobile unit verse a virtual solution for specific care services. Locations with low transporation AND low technology indices are prioritized for mobile services, while other locations are suitable for virtual care alternatives.

HDMS offers over 25 SDoH indices and dimensions.
Start with composite indices that allow you to look broadly across a number of factors at once. Use focused indices to support very specific or nuanced investigations, like food access or social isolation. They can also be used together – for instance the transportation index and the technology index example we shared above.
Have a good understanding of which social or environmental factor you are investigating and where that index is sourced. There are a wide variety of options. Nothing will be perfect. Some indices are more complete, more granular, more recently or frequently updated, than others. As you interpret results, have transparency around the process leading to the metrics. This will help everyone interpret and apply insights better in the long run.
TIP: Enriching claim data delivers fast and intuitive investigations. This makes SDoH analytics easier too.
Enrichment can have many forms: classify claims by episode treatment groups (ETG), apply pharmaceutical classifications, and flag specialty druges. Enrichment processing also identifies gaps in care and low value care and makes it easy to surface these individual moments into analytics.
ER visits that have been classified using the NYU methodology allow you to quickly look at who visited the ER for non-emergent care, just by using a few filters. Now think how powerful it is to further see these visits by income index.
As we think about integrating new data to investigate social determinants of health, we naturally focus on the new data – the addition. But we need to link that to core health data. Let’s not forget the quality and usability of those systems or sources. The data quality processes surrounding your traditional analytics are a critical part of trusted SDoH insights.

HDMS Enlight offers the most comprehensive out of the box SDoH analytics on the market.
Explore SDoH Analytics Contact us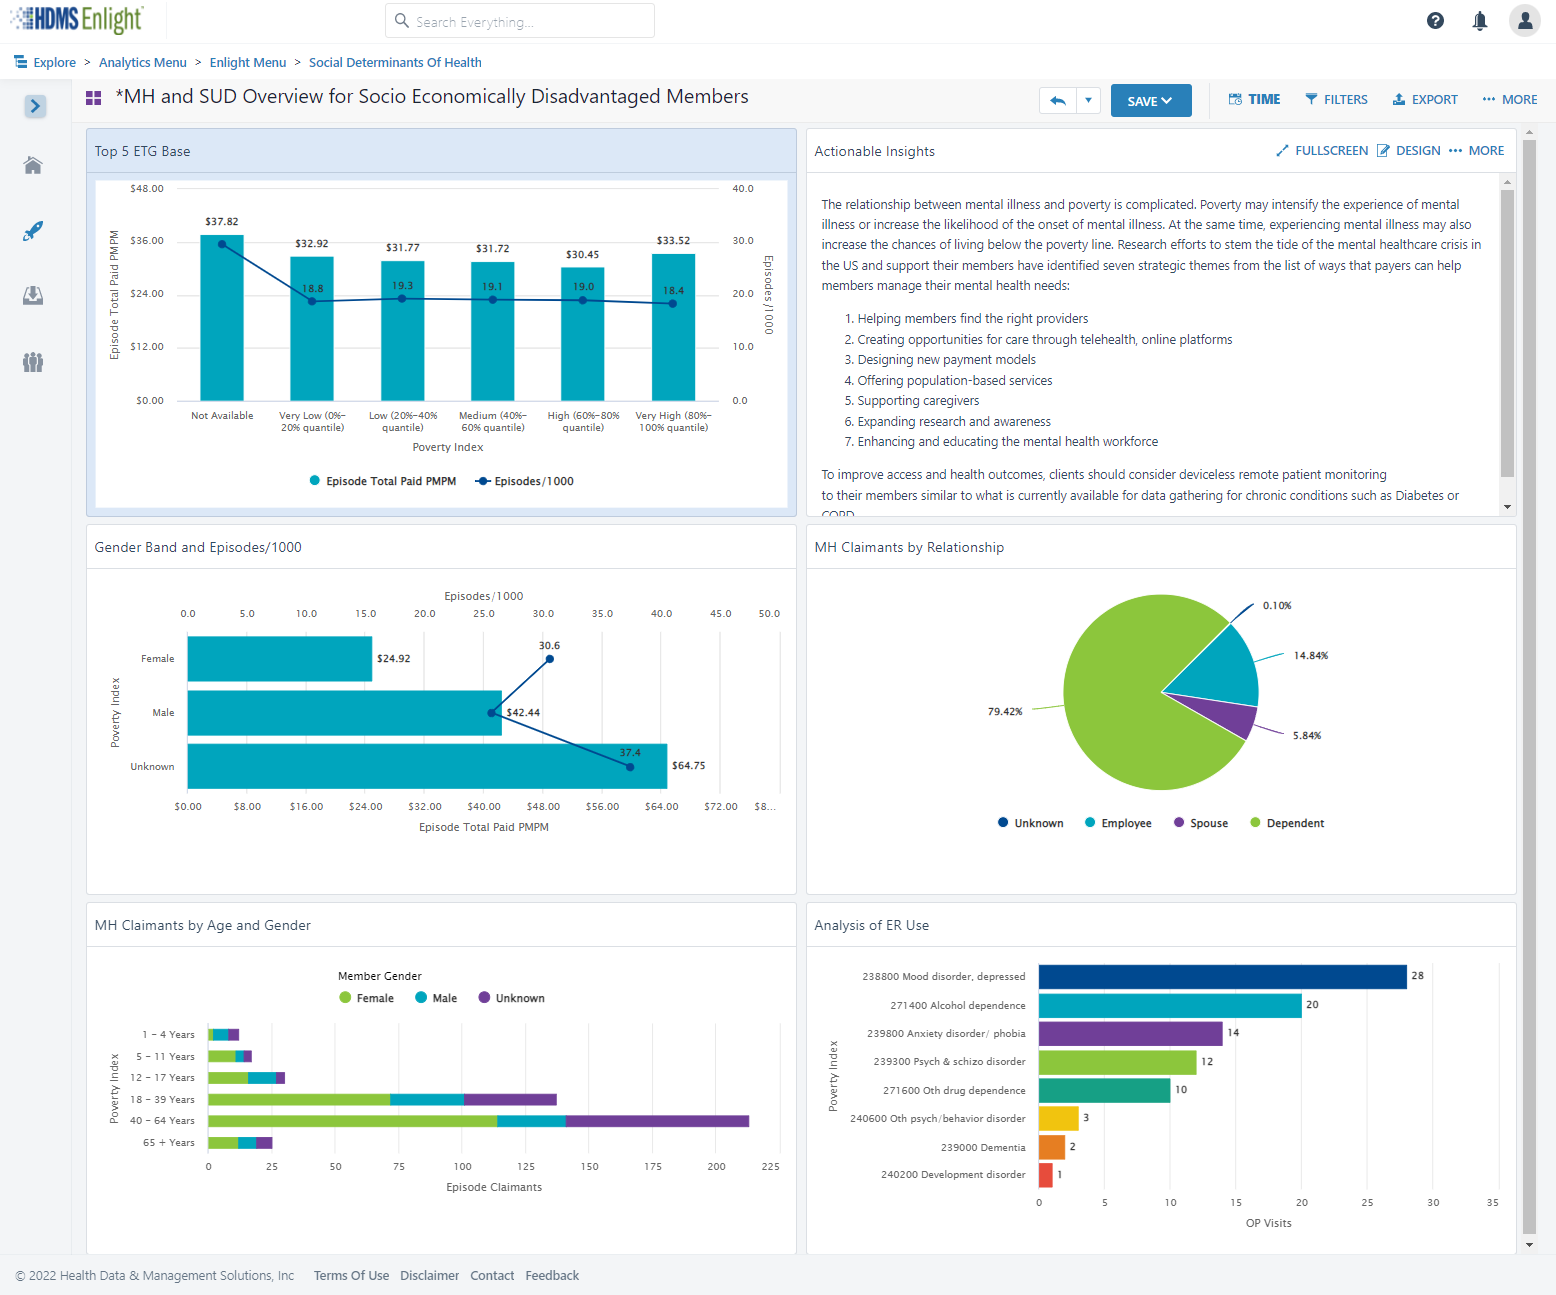
Did you ever have a home improvement project that finished late and cost more than you expected?
How about a technology implementation that finished late and cost more?

You are more likely to be on-time and on-budget if your plan is thoughtful and reflects your reality. Have confidence and know what you’re really getting into! Health data is very complex.
One-size does not fit all. It’s unlikely your implementation is the same as other organizations. Why?
Dig in. What are the details behind YOUR implementation plan?

Discuss what will be problematic or painful based on your experience and what you are moving away from. Are those complexities appropriately addressed, cared for, or resourced? Think about metric definitions and consensus, data quality, data reconciliation, matching and integration across sources, and slowly changing history.

Identify what is- and is-not in your control. If something is beyond your direct control, is there a named resource and escalation path? What risk does that pose to the project timeline based its nature. For instance, your health analytics implementation is reliant on data from others. How are your relationships and service level agreements with those partners and vendors? How does that affect your plan and what’s the back-up plan?
Before your implementation starts, refresh your knowledge of the day-to-day contacts, authorities, and any contractual SLA’s you have in place. If there will be costs associated with establishing new feeds or data interfaces, identify those early.
Top down, bottom up, or an interesting mix? Think about the approach that will work better for your organization. What process works for you – here’s my data – what can I do with it? Or here are my objectives – what data do I need? There are pros and cons to each but thinking about this as you prioritize is invaluable for setting internal expectations and getting the right resources lined up.

Use phase 1 for quick wins. Standard sources generally seamlessly populate the most common views. Users feel like they get a lot out of the gate and that helps tremendously with adoption.
Remember, you’re better off with an implementation plan that’s realistic rather than one that sounds like a dream but doesn’t work well for you in the end.
Learn about Enlight What is it like working with HDMS?
What can data tell us about mental health? What can we do better?
Take a look at how the same data can be used, in different ways, to understand the quickly changing needs around mental health care services. Look at trends, leading indicators, predictions and prescriptive actions. Do more with data.

Watch an example of how we engage with clients. Learn more about how an Analytic Agenda supports a vision and moves health forward.

The COVID-19 Cost Model built by HDMS is used and adapted to meet our client’s needs and interests. We invite you to download this model and use as-is – or customize it to suit your specific needs.
Read on for a few tips to get the most out of your COVID-19 cost model:
Get the COVID-19 cost model
Use a cross-functional approach: Obtain representation and contribution from across the organization, with inputs from Finance, Data, and Clinical/ Healthcare Specialist resources, at a minimum. Clinical/Healthcare Specialists ensure your model is answering key questions, contains accurate assumptions, and reflects current thinking. Your data team, working in collaboration will create efficiencies in balancing what you want to know and what data is available to support this investigation. They can help build for a refreshable model and possibly introduce new ideas to the team based on data possibilities. The finance team will guide calculation accuracy and are usually great partners to help with organizational buy-in and create confidence in the model.
Build for ranges: Create a model framework that invites ranges both as inputs and outputs. The template provided contains both range estimates and is constructed for three case scenarios to help accommodate different organizational approaches. This increases the usability of the model, as ranges communicate a realistic spectrum. By understanding how large the range can be, you innately create context for anyone using the model outputs.
Create in parallel: Again, collaboration is key. Let data analysis help inform increasing specificity for your cost model. As you develop your model, assess the data available to support increased granularity and actionability. Bring in member demographics like age, gender, geography and use historical health insights along with HR data to consider health risks, role type and job type considerations. Health plans might also wish to analyze by industry, geography, plan type, or other business attributes for additional aggregated insights.
Build assumptions as variables: What we know is rapidly changing and evolving. By building assumptions in as variables, rather than use within formulas, you can update your assumptions more easily and completely. Showing the values as variables on the model itself also creates transparency so it is clear what is used in calculations.
Make the model self-documenting: Document within the model itself. Cite and link to sources, show assumptions as variables as shared above, and create a high level of transparency to help answer as many questions as possible. Make it easy to check sources to see if recommendations or assumptions merit updating based on evolving information.
Download the HDMS COVID-19 Cost Model to see and play with a working model. If you are an HDMS client, reach out to your customer experience team for a more detailed and customizable model that works cohesively with your HDMS implementation.

Using analytics to impact costs and manage trend