since 2019, according to a recent study.**
*109 claims per million members in 2019 to 158 in 2022.
**SunLife study from May 2023.

Stop-Loss coverage de-risks self-funded employers from catastrophic or unpredictable losses associated with high-cost claimants. Stop-Loss itself is not medical insurance – it’s a financial and risk management tool.
Annual premiums increase when too many claimants exceed their deductible. Be data-driven to reduce long-term costs.
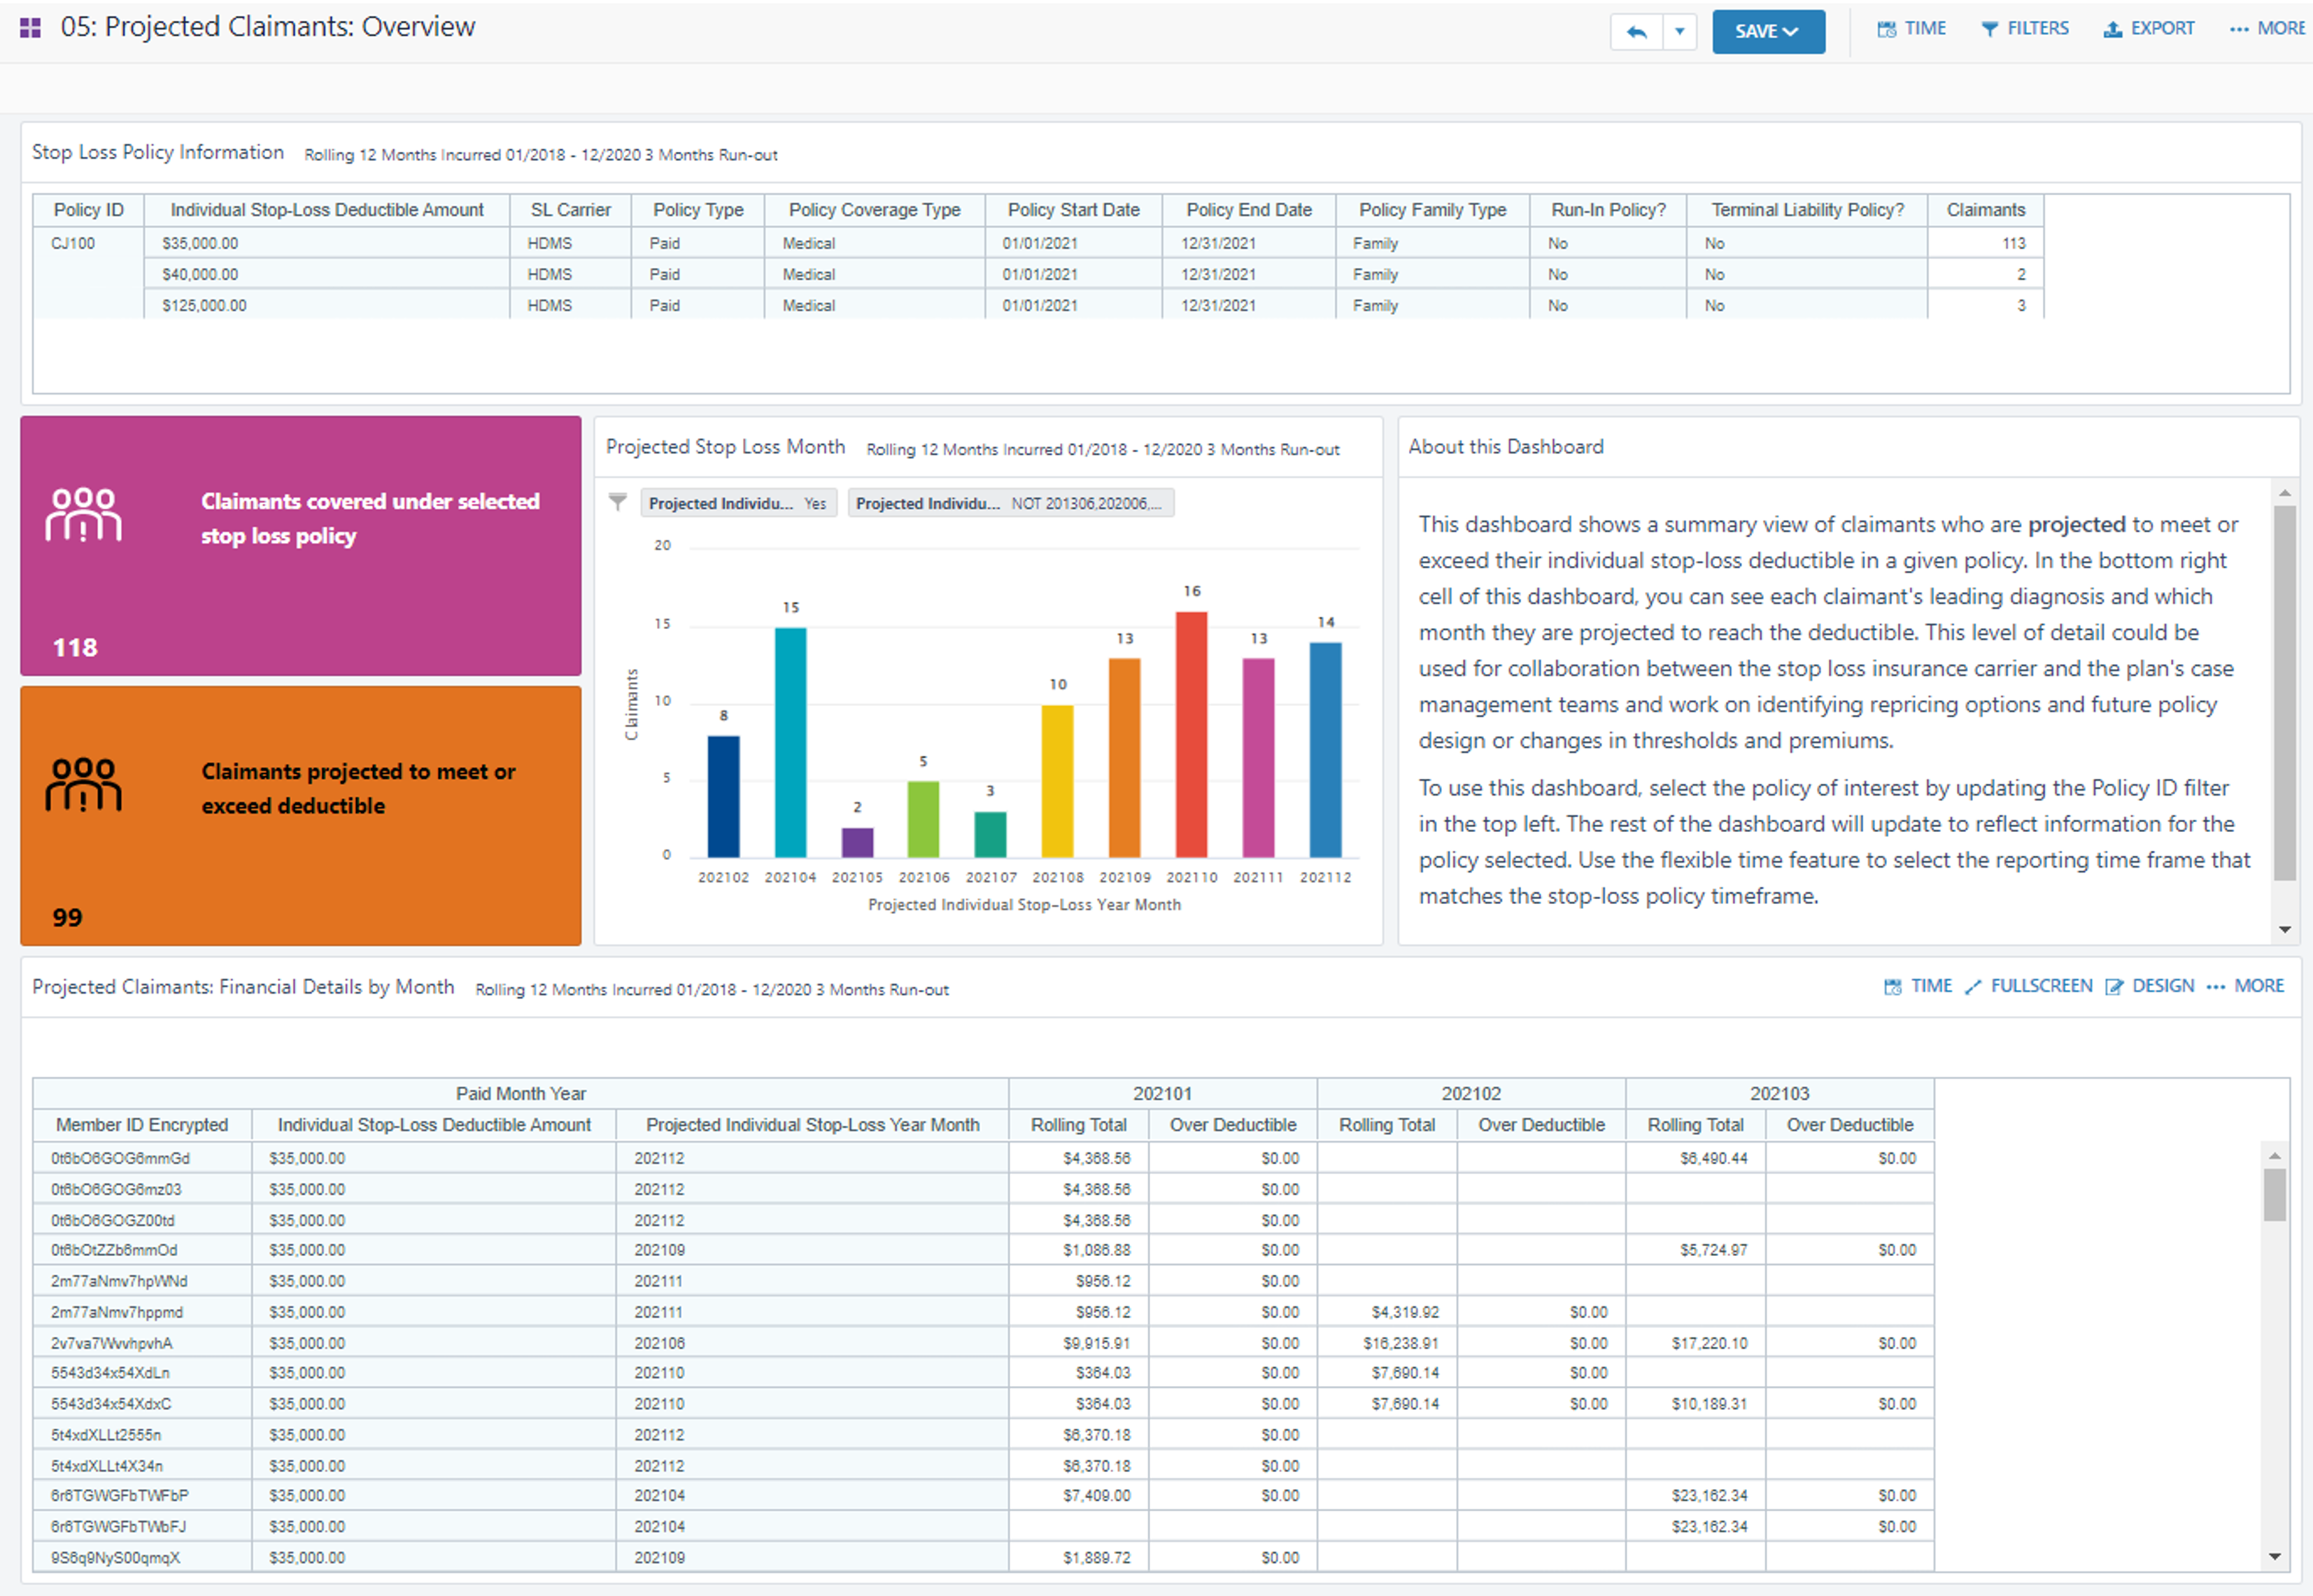
See members and amounts, even before they hit a Stop-Loss deductible threshold. See details around:
Flags members that meet policy trigger criteria (diagnoses, conditions, specialty Rx, etc.) on a running basis. See running totals.
Shows month-by-month actuals and projections. See who is likely to meet or exceed deductibles and when for accurate planning.
Uncovers rising risk. See who is approaching (configurable) thresholds, like 80% deductible AND projected year-end estimates.
Ingests your existing policy and adapts analytic processing to your contract details
Reports reflect your policy, configured thresholds, and risk definitions
Predicts which members will meet deductibles
Process sophistication accounts for Laser lists and varying deductibles.
Increase the accuracy of forecasts, plans, budgets, spend and financial reporting
Design across health plan and stop loss policies to optimize costs
Help members with hyper-personalized care plans and healthcare resources
Stop-Loss policies are highly customized. Many include laser lists – these contain specific individuals expected as high-cost claimants. These individuals have a unique (higher) deductible.
Accurate laser lists ultimately keep Stop-Loss premium lower for the rest of the population.
Smart Stop-Loss packages up information for easy decision-making for next year’s laser lists based on existing health profiles and individual costs.
All analytic views produce results that account for each member’s unique deductible amount.
Learn more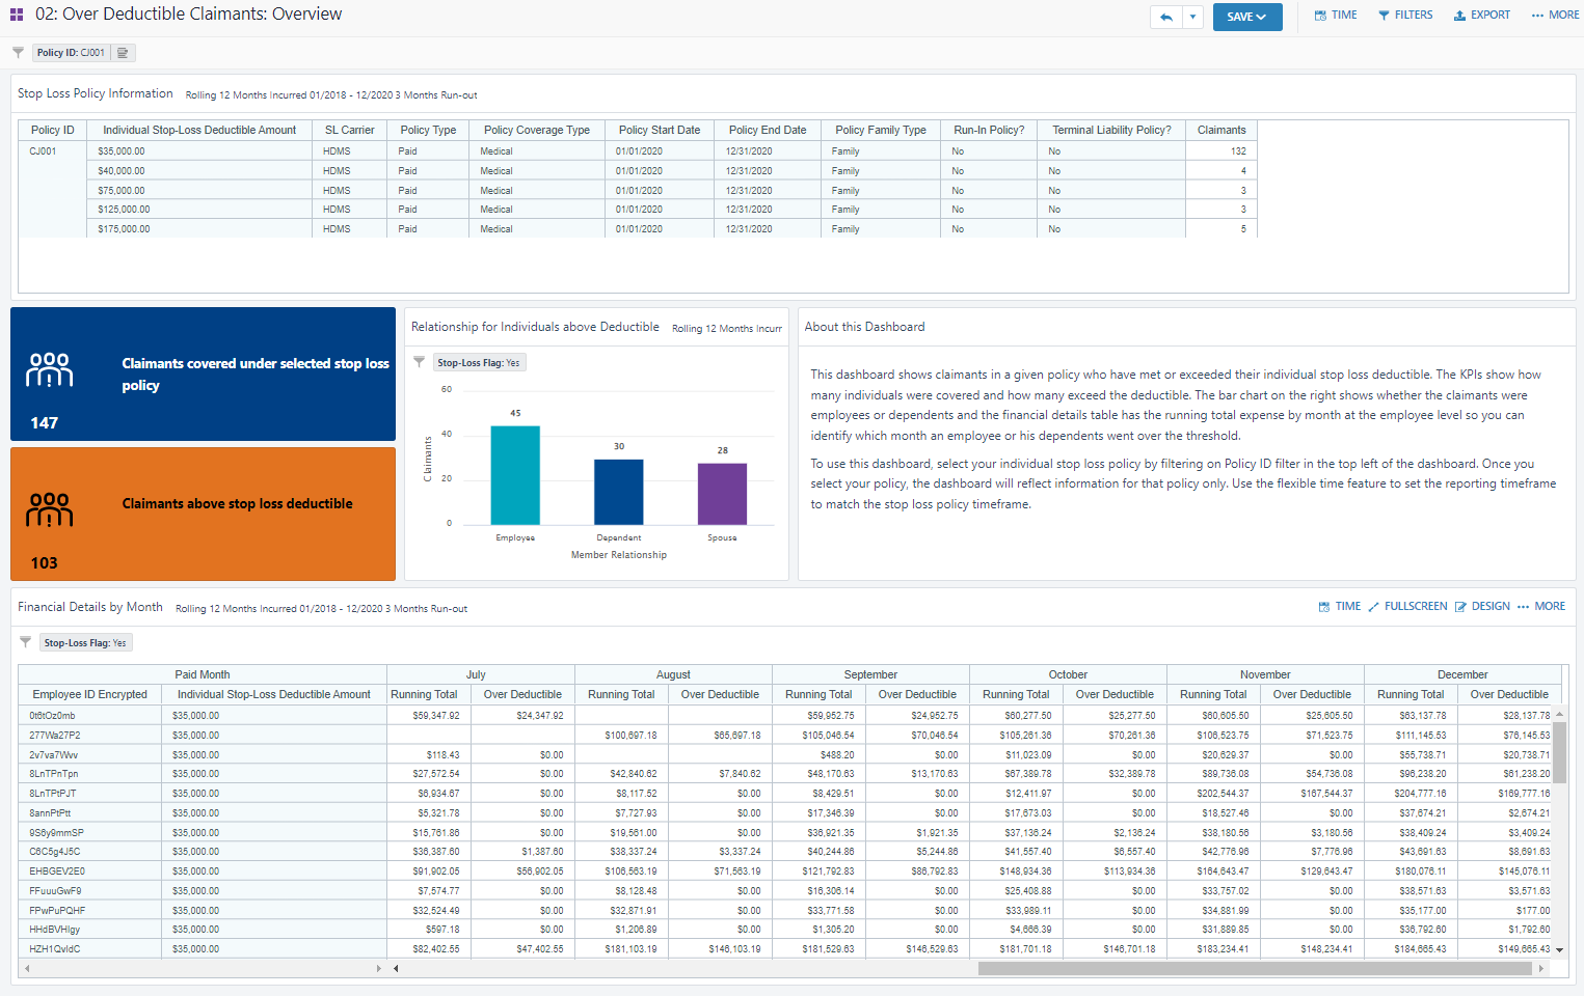
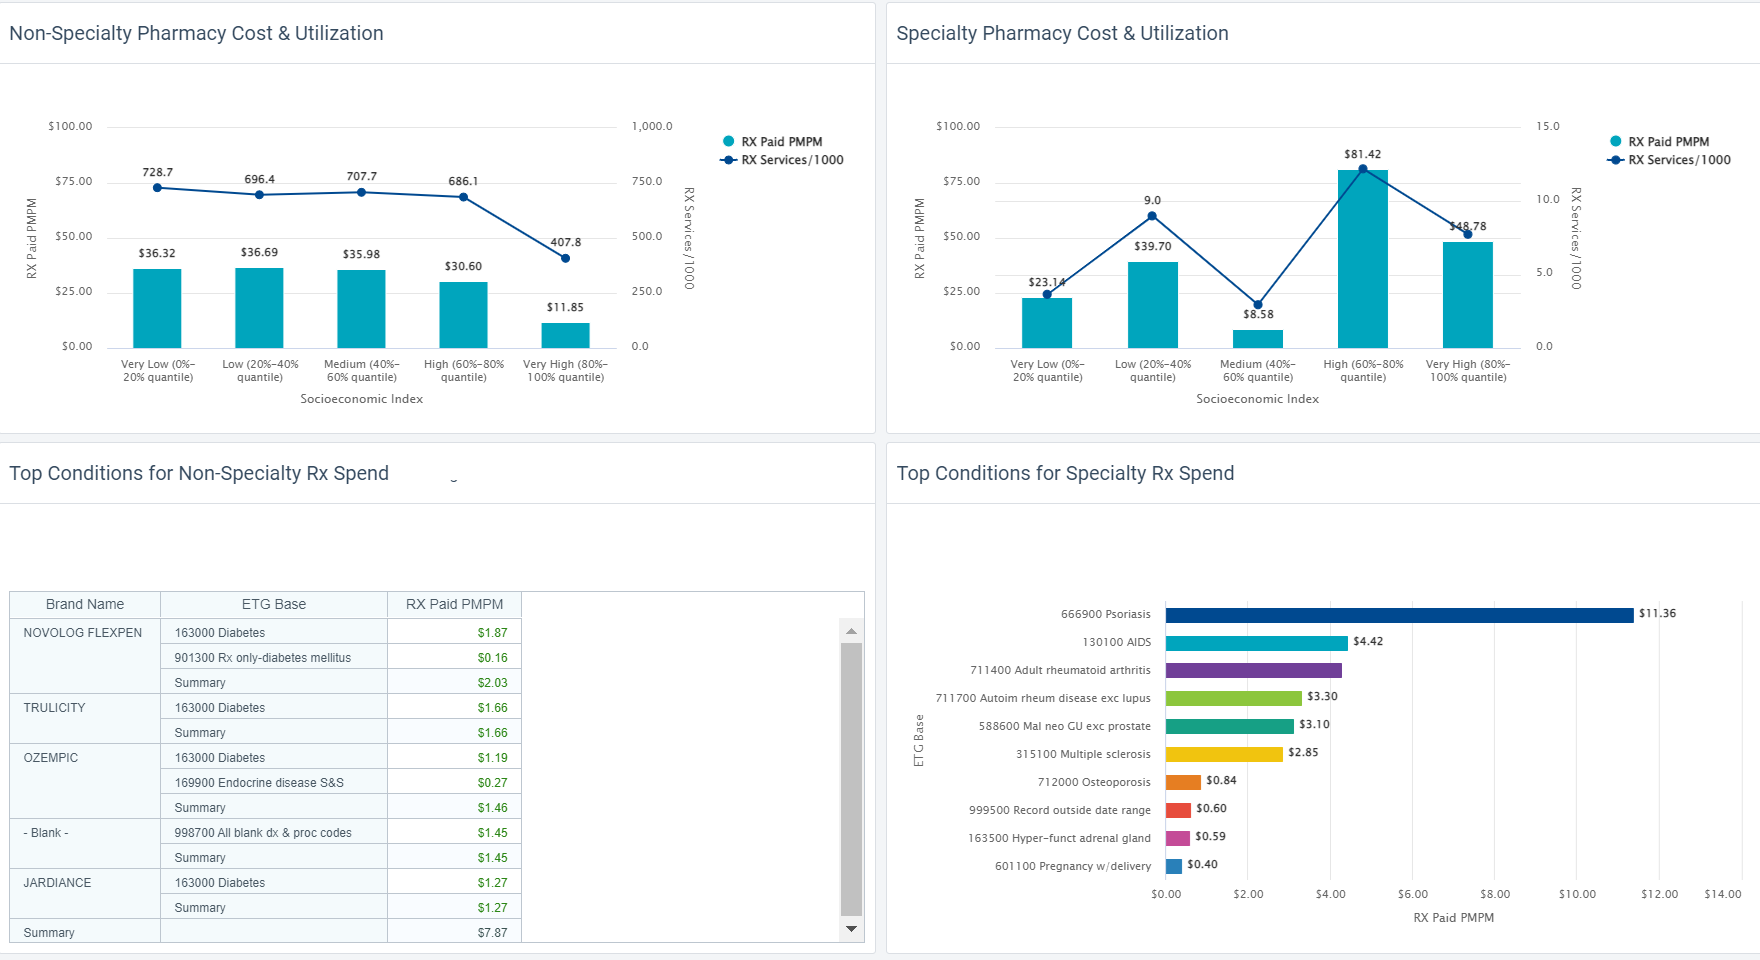
Ozempic has made headlines recently, for trending off-label uses.
HDMS Analytics Practice digs into a data set using new analytic content. See emerging trend insights that surprised our team.
Read now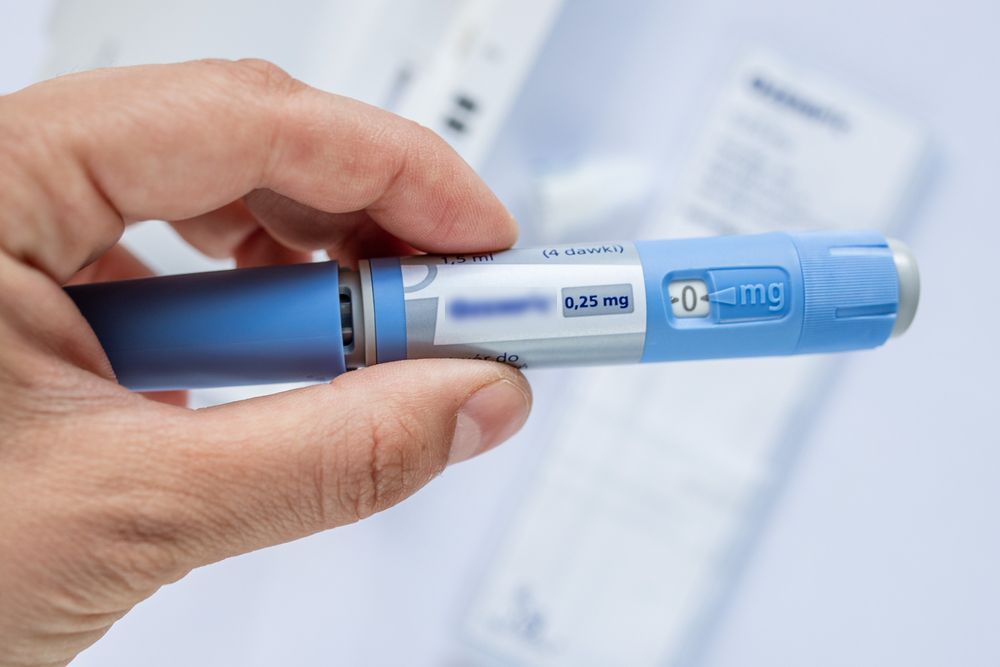
Reduce costs, improve health
Read about what the most strategic and innovative players doingto address rising costs as they design and manage benefits and plans in 2024.
Read Now

Read about key trends and what this means for employers.
Connecting trends to benefits strategies
Health care is changing quickly.
Read about the top 5 trends in health care and the analytics you can use to navigate plan design with confidence.
Read Now
Quantify them
Measure ROI
Understand connections
Connecting it all
Reverse delayed care habits

Read about key trends and what this means for employers.
Connecting trends to benefits strategies
We’re used to looking at a lot of healthcare metrics – utilization, costs, outcomes. Even just a little more data can tell us a lot more about people in context.
Check out how Plan Sponsors are surfacing measurable differences within their populations, by adding just a little more data into their analytics.
See some examples See a webinar
We’ll help you get started on measuring how healthcare needs and patterns change across different subpopulations at your organization.
Amplify analytics with SDoH enrichment. This helps reveal health inequities.
Learn more
See how easy it is to look at how social determinants of health influence your population. Find where inequities exist and track progress of program efforts.
Measuring these differences allows us to take what we anecdotally see or suspect, and support it with facts.
Collegaues focused on Diversity, Equity, and Inclusion (DEI) agendas are wonderful partners. Share these insights with them. The numbers give your organization a brilliant set of facts to help drive decisions aligned to company goals.
We’ll help you surface these insights at your organization. Contact us to hear more about the possibilities.
With digital transformation improving health experiences, we now have even more Big Data in healthcare to use for deeper insights in population health.
When it comes to health analytics and DEI efforts, what data do you need? How do you get it? How can you get started? What happens next?
We’re so glad you asked – hear from our experts.
Originally presented as part of an AHIP webinar series.
Watch now Download the slides
through the lens of diversity equity, and inclusion.

Rani Aravamudhan is a more than a physician, specializing in General Medicine. She has extensive experience in the EMR/EHR and population-health industries with a focus on clinical transformation, workflow design and development, value-based care, risk management and clinical quality and performance reporting. Her strong background in clinical medicine and experience in the HIT industry make her successful in navigating payer, provider, and technology vendor landscapes.

Jason Elliott is Vice President of Customer Experience for Employer clients at HDMS. A true public health enthusiast with a Masters in Epidemiology, he spent over a decade delivering dedicated clinical analytics and leadership at BCBS. Since then, Jason has managed the managed the Employer practice area. He brings very structured thinking into the types of problems his clients are trying to solve, and what can be done with the insights discovered.
SDoH analytics requires a lot of data, and different types of data. Claims data tells us about health care visits. Digital device data tells us about daily health. And special data sets let us delineate the social and environmental factors that could influence each member.
In SDoH analytics, we understand each person as an individual and in context, but look at a community as a whole in aggregate, to see what trends and patterns emerge.

Here are 5 important aspects to consider, and tips of what to look for, so you can trust the insights in your SDoH analytic endeavors.
Wellness means care and lifestyle choices. This data is scattered across many different places. Health analytics must integrate complex claims data structures and lifestyle data at an individual person level. SDoH analytics should also be connected at a person level. This way, the data is ready to serve all the analytic questions you may ask, without additional data preparation and delays.

The more granular a data set is, and assuming it is associated at a member-specific level, the more trustworthy and usable your SDoH insights will be. Think about the variation of social and environmental factors you see across an entire zip code. Now think about the degree of variation you see within a neighborhood. A Census Block Group is akin to a neighborhood. This means if you have source data that has a Census Block Group level of granularity, you are seeing only the degree of variation across neighborhoods, not entire zip codes.
Social and environmental factors cover a broad range of influences on health. Air quality or water quality? Economic hardship or transportation access? There is so much we can do if we have lots of different SDoH indices to choose from. For instance, one HDMS client is looing at the transporation index alongside the technology index to assess the potential usefulness and impact of a mobile unit verse a virtual solution for specific care services. Locations with low transporation AND low technology indices are prioritized for mobile services, while other locations are suitable for virtual care alternatives.

HDMS offers over 25 SDoH indices and dimensions.
Start with composite indices that allow you to look broadly across a number of factors at once. Use focused indices to support very specific or nuanced investigations, like food access or social isolation. They can also be used together – for instance the transportation index and the technology index example we shared above.
Have a good understanding of which social or environmental factor you are investigating and where that index is sourced. There are a wide variety of options. Nothing will be perfect. Some indices are more complete, more granular, more recently or frequently updated, than others. As you interpret results, have transparency around the process leading to the metrics. This will help everyone interpret and apply insights better in the long run.
TIP: Enriching claim data delivers fast and intuitive investigations. This makes SDoH analytics easier too.
Enrichment can have many forms: classify claims by episode treatment groups (ETG), apply pharmaceutical classifications, and flag specialty druges. Enrichment processing also identifies gaps in care and low value care and makes it easy to surface these individual moments into analytics.
ER visits that have been classified using the NYU methodology allow you to quickly look at who visited the ER for non-emergent care, just by using a few filters. Now think how powerful it is to further see these visits by income index.
As we think about integrating new data to investigate social determinants of health, we naturally focus on the new data – the addition. But we need to link that to core health data. Let’s not forget the quality and usability of those systems or sources. The data quality processes surrounding your traditional analytics are a critical part of trusted SDoH insights.

HDMS Enlight offers the most comprehensive out of the box SDoH analytics on the market.
Explore SDoH Analytics Contact us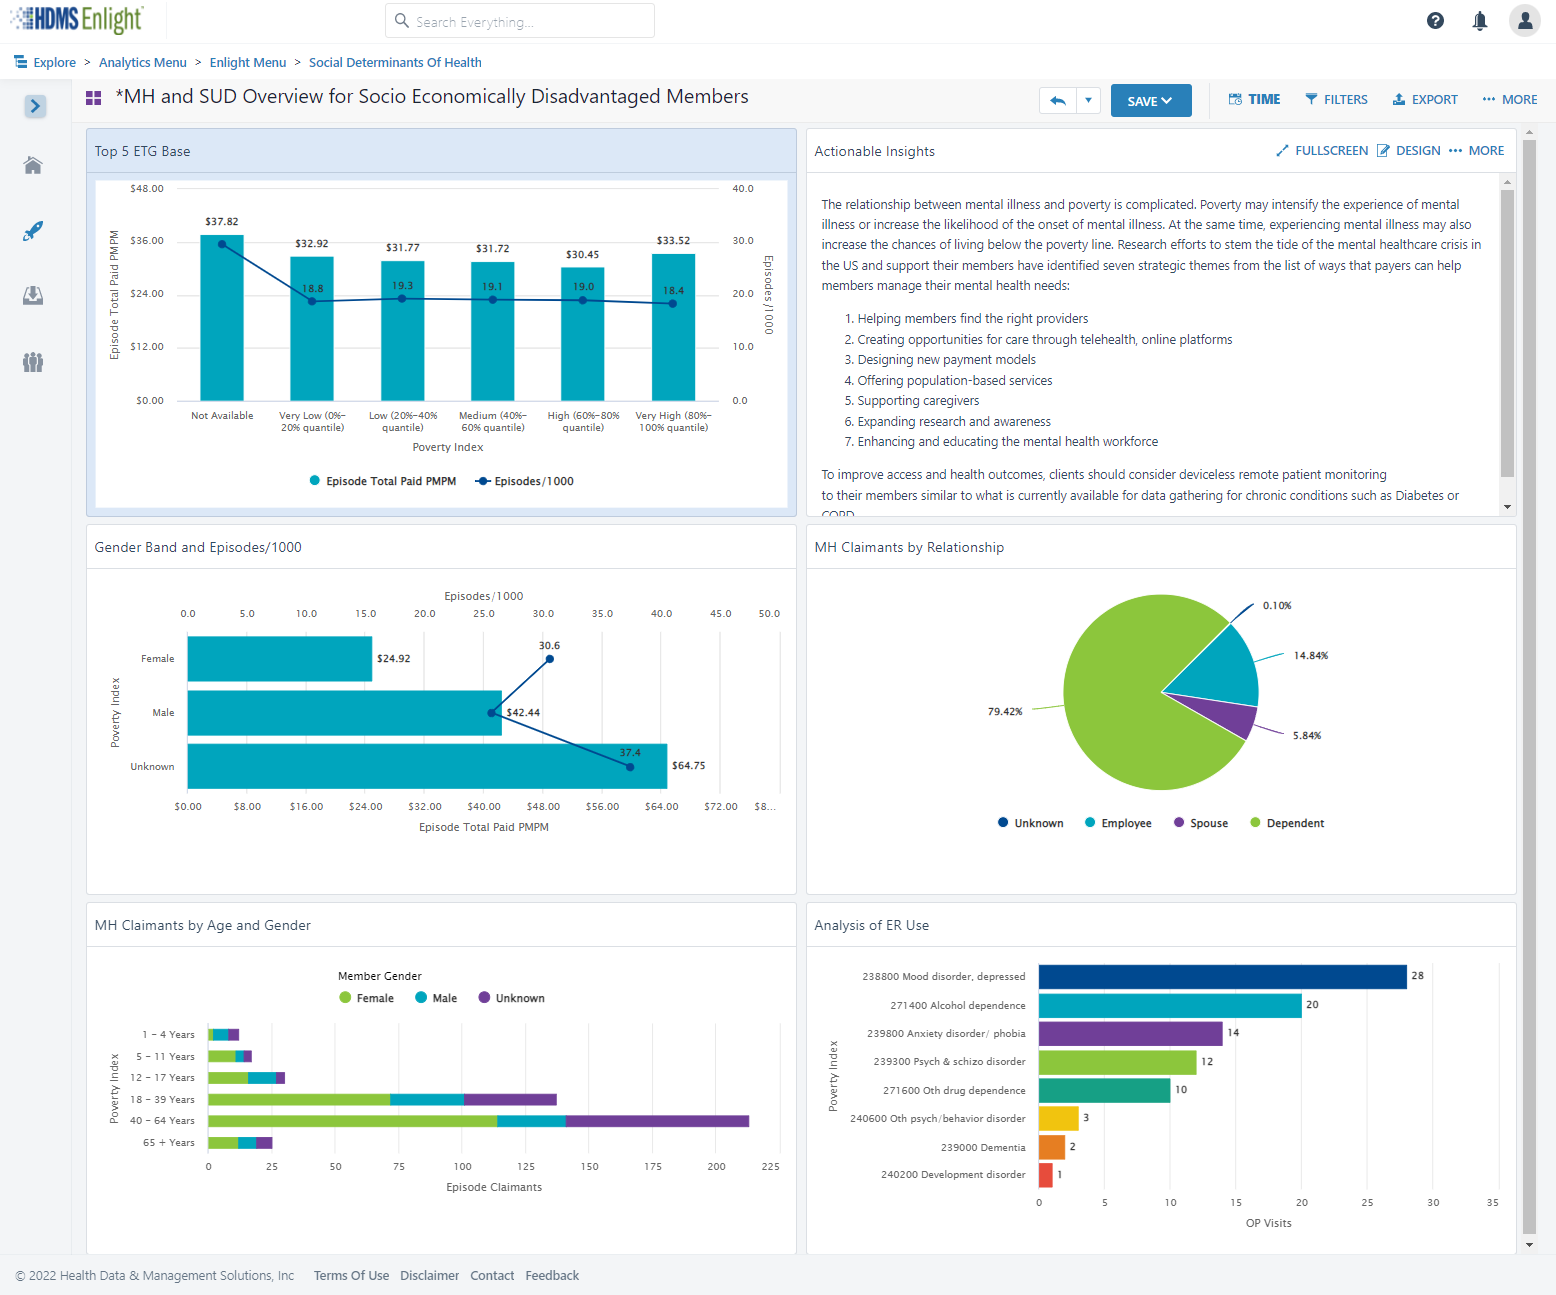
as part of health and wellness benefits.
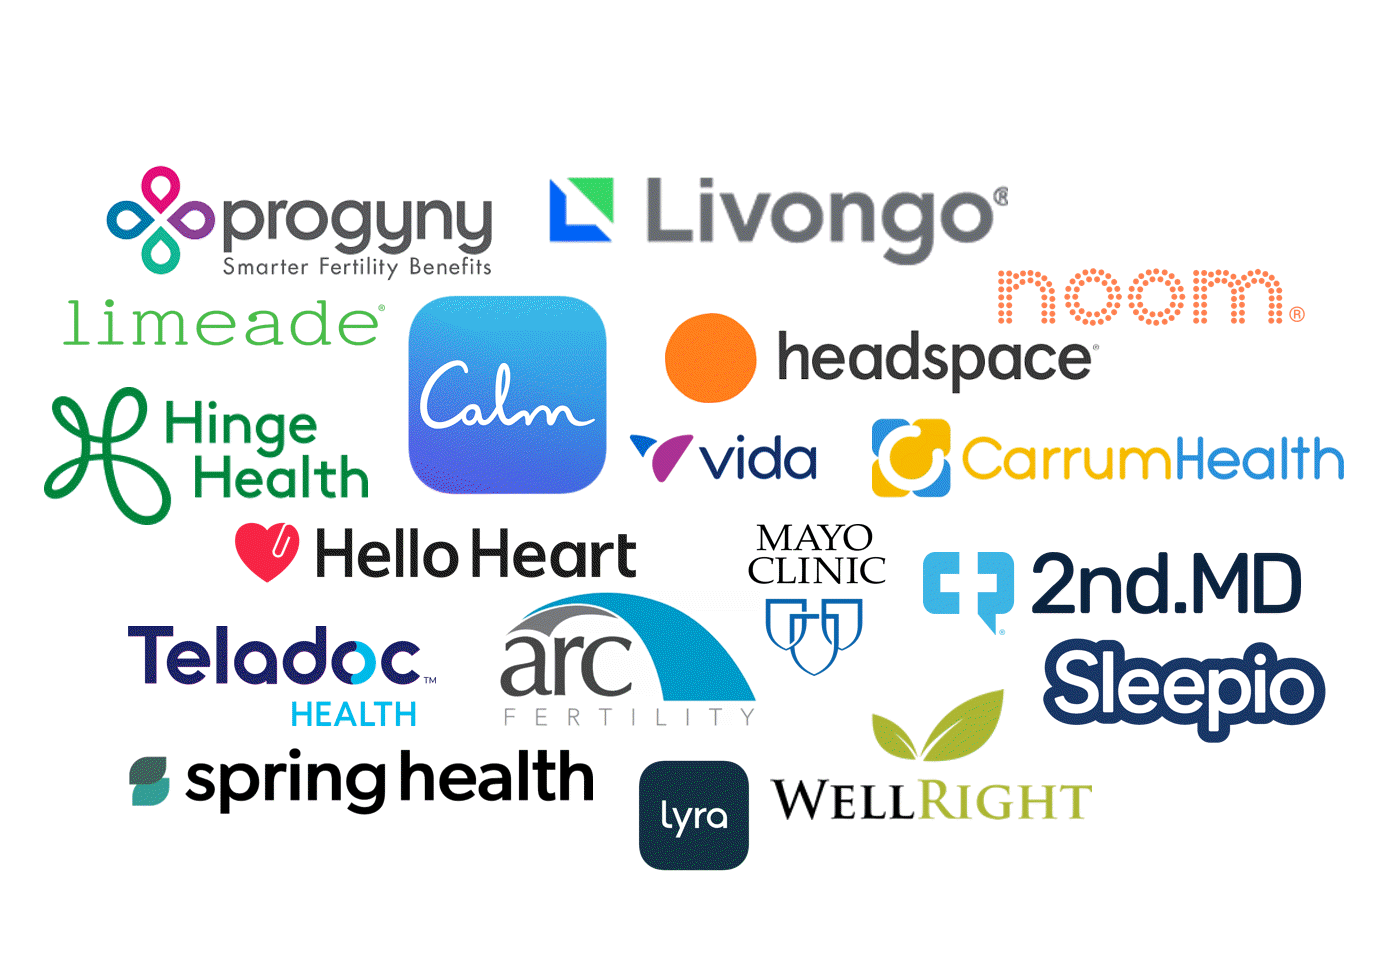
Point solutions have been a great way to enhance benefits and provide care for a targeted need.
But as point solution costs add up, the pressure increases to understand, and sometimes PROVE, the value.

Most firms offer programs to identify health issues and manage chronic conditions (health risk assessments, biometric screenings, and health promotion programs).
83% of large firms offer a program in at least one of these areas: smoking cessation, weight management, and behavioral or lifestyle coaching.
Source: Kaiser Family Foundation study
Cohort comparisons are the ultimate analytic strategy for proving value. Without a direct comparison within the same population, there are so many factors that introduce doubt on what the numbers truly capture. Alternatively, by looking at well defined and specifically differentiated groupings of people, we can directly compare performance take away concrete and specific learnings.
Here’s a good example from our client base: This national retailer wanted to measure the value of a Center of Excellence strategy for heart conditions. The metric strategy compared a well-defined pair of cohorts that looked beyond traditional utilization and cost metrics. We helped them also include mortality rates (COE – lower), returns to work (COE – faster), outcomes (COE – better), and company satisfaction (COE – higher). Yes, that’s right – employees actually reported a higher employee satisfaction rate on the survey following a major episode of care.
Often “What’s the value?” is the wrong question. The correct question is “Who is this valuable for?” or “What’s the incremental value?”
There will always be a portion of a population that is engaged in their health and wellness. Your data can tell you who this population is, and provide insights that help you identify more people “like them” that you can target and pull along, therefore increasing program value. Also consider if the engaged audience would have been healthy or well without the special program, in some other way. Is it the program – or the people – that are providing the results you see?
Choice might be the right choice. The optimal strategy may not be selecting the best performing program in some cases. Use data to confirm if similar point solution programs are engaging the same or different audiences.
One self-funded employer had two somewhat similar wellness point solutions – Solution A emphasized “exercise and feel better.” Solution B emphasized “Eat right and feel better.” They both showed value – which one should they keep?
A deeper investigation of the data revealed that the solutions were in fact engaging somewhat different audiences. The self-funded plan sponsor found they increased the value of BOTH point solutions by understanding the demographic nuances, and creating more targeted communications and incentives that used these insights.

Don’t wait for results (e.g., traditionally after year 3 of data is collected and analyzed). Design metrics that act as leading indicators. After year 1, plan to optimize and performance tune. Move the conversation. Avoid “Wow – it looks like our MSK program had trouble engaging our guys in the warehouses even after 3 years,… should we look into a different solution or approach?” Prepare for, “Wow – it looks like our MSK program is having trouble engaging guys in the warehouses – what’s our plan to tackle this as we plan for year 2?”

Understand how social determinants of health influence engagement and utilization. Then optimize the point solution to meet broader needs by removing barriers. The data can show you where actions will be impactful.
Data that provides insights into social determinants of health can be time consuming to assemble into an analytic environment and then align to member health data. And yet it’s so powerful for insights. Your analysts time is better spent using this data as opposed to prepping it manually.
We evaluated medical and dental claims for diabetics after the introduction of a new Virtual PCP program. The solution was selected after seeing a statistically significant difference in PCP utilization across various household income segments. We created a specific scope around diabetics to study impacts on utilization, medication adherence, medical costs, and co-morbidities in mental health. Not all investigation can rely solely on data. The task force team worked with “Voice of the Member” groups, formed based on specific demographics. They focused on understanding context and color behind the numbers. Transportation, time away from work, and caregiving themes arose in the care access category. Other reasons were also presented, but offered less immediately actionable solutions.
With less time prepping data, the team had more time to dig deep, address quantified specific barriers, and is now measuring impact.
Check out how easy it is to include Social Determinants of Health (SDoH) factors into an analysis.
HDMS Enlight makes it easy to put these best practices to work.
Learn more Contact us for questions
Did you ever have a home improvement project that finished late and cost more than you expected?
How about a technology implementation that finished late and cost more?

You are more likely to be on-time and on-budget if your plan is thoughtful and reflects your reality. Have confidence and know what you’re really getting into! Health data is very complex.
One-size does not fit all. It’s unlikely your implementation is the same as other organizations. Why?
Dig in. What are the details behind YOUR implementation plan?

Discuss what will be problematic or painful based on your experience and what you are moving away from. Are those complexities appropriately addressed, cared for, or resourced? Think about metric definitions and consensus, data quality, data reconciliation, matching and integration across sources, and slowly changing history.

Identify what is- and is-not in your control. If something is beyond your direct control, is there a named resource and escalation path? What risk does that pose to the project timeline based its nature. For instance, your health analytics implementation is reliant on data from others. How are your relationships and service level agreements with those partners and vendors? How does that affect your plan and what’s the back-up plan?
Before your implementation starts, refresh your knowledge of the day-to-day contacts, authorities, and any contractual SLA’s you have in place. If there will be costs associated with establishing new feeds or data interfaces, identify those early.
Top down, bottom up, or an interesting mix? Think about the approach that will work better for your organization. What process works for you – here’s my data – what can I do with it? Or here are my objectives – what data do I need? There are pros and cons to each but thinking about this as you prioritize is invaluable for setting internal expectations and getting the right resources lined up.

Use phase 1 for quick wins. Standard sources generally seamlessly populate the most common views. Users feel like they get a lot out of the gate and that helps tremendously with adoption.
Remember, you’re better off with an implementation plan that’s realistic rather than one that sounds like a dream but doesn’t work well for you in the end.
Learn about Enlight What is it like working with HDMS?
Companies are using predictive analytics to get the right people to the care they need. Think about it – predictions aren’t truely valueable unless we act upon them to either avoid a negative prediction, or accelerate a positive prediction.
Read these 3 use case examples to help inspire new ideas about how your organization can be using predictive analytics.
What are some use cases and ideas for intervention strategies?
Download here
Want help finding risks?