
And what these mean for Employers
What are some key trends impacting the business of healthcare and what can this mean for you, as a self-funded plan sponsor?
- costs are rising
- the health system itself is evolving
- DEI, SDoH and artificial intelligence invite new opportunities
In two words – EXPENSIVE + CHANGE.
Take control and use the massive amounts of data available. Health analytics will help you strategically navigate market transformation, minimize excess costs, and gain first-mover advantage to secure cost avoidance. All with optimal outcomes.

CMS.gov shared that U.S. health care spending increased 9.7 percent and reached $4.1 trillion in 2020. The health “share” of our economy is projected to rise from 17.7 percent in 2018 to 19.7 percent in 2028. The most significant driver behind this is primarily driven by increases in health sector wages.
As a payor, you’ll want to have the right tools and/or partnerships in place to be able to accurately anticipate and confidently strategize regarding your portion of costs.
Offset increases in costs by optimizing plan performance. Use analytics to surface savings opportunities. The Great Resignation and turnover may have changed your employee base signficantly, and needs themselves are evolving. You’ll need a refreshed and keen understanding of the workforce’s needs, utilization patterns, and engagement preferences.
Let’s assume you made solid decisions around health plans, plan administration, programs and policies. Now, get the most out of these choices and proactively drive to the highest level of value possible.
Offset increases in costs by optimizing plan performance.
Eliminate guesswork. Use health data to get the most out of partners and programs.

We’re watching the pandemic accelerate the adoption of virtual care and at-home care. We see business investment and digital innovation compliment longstanding desires for an increasingly streamlined, affordable system with improved care access and health equity.
Providers and carriers continue to explore and innovate business models. Value-based care options and accountable care organizations are growing. There are countless new market entrants in the wellness and point solution space.
New health programs and options may offer interesting visions, yet leave employers with many unknowns.
Build a repeatable model that lets you easily pilot new approaches and comparably measure results. Find a partner to do the heavy lifting around data sourcing and management. Focus your precious internal resource time on using insights with leadership and making strategic decisions. Choose business partners with seasoned consultative and analytic specialists to track and compare cohorts. Create holistic views that show associated impacts and connected costs. Lean on your partner’s expertise to define metrics and analytic views in ways that support decisions around program expansion, change, or termination.
Create a data-driven program and repeatable model that lets you pilot new strategies or programs and compare measured results.
For example, pilot and analyze: Which joint replacement care approaches have the shortest associated disability duration, fewest average physical therapy visits, and lowest prescription costs?

Survey results* that report statistics like 83% of U.S. organizations reported implementing diversity, equity and inclusion initiatives in 2021 and political activity like The Improving Social Determinants of Health Act of 2021 (S. 104/H.R. 379)**, illustrate the magnitude of momentum.
Read more about it here* and here**.
2022 invites enormous opportunity to drive change by partnering with emerging DEI leaders who bring passion and creativity to evolving program design in ways that accommodate a broader set of needs. The very qualities that make us unique and special and our social environments (both home and at work) influence what works well for each of us when it relates to health. Employers that can measure what’s working for whom are set up to make smart and responsible benefits design decisions tailored for their population.
Create a data-driven, measurable DEI and SDoH framework around your benefit offerings. This could be looking at traditional metrics by salary range or race, incorporating third-party regional SDoH data, or even looking at variances in condition prevalence based on job types. Look at a minimum of 2 years of baseline data and prioritize equity gaps and key drivers. Host small group lunches to ask employees for context around what you see in the numbers. Engage with health plan- and community-based resources alternatives. With analytic rigor surrounding your efforts, and a multi-disciplinary approach, you’ll see an impressive impact.

Recognize your ability to support the whole person through benefits design. Hit the streets and ask your employees what’s important and what is needed.
It’s a great time to listen to what people say, and measure what they do. In addition to adding mental health benefits, pilot environmental changes. How do a blend of policy updates (e.g. mandatory meeting-free lunch-and-wellness hour?) and benefits expansion (coupled with a wellness program with fitness incentives) associate to employee satisfaction survey data and business goal measurement? The data exists. It’s just a matter of analyzing it.

Artificial Intelligence (AI) and Machine Learning (ML) are being applied for clinical innovation in areas like medical imaging, drug discovery, and to predict disease early. These are areas beyond an Employer’s realm. But these same technical innovations are useful in population health management – for planning, resource management, and targeted communications.
You’ll see more and more talk about health Big Data being used to define health experiences that personalize care, address diverse needs and preferences, and icrease engagement.
As an Employer, you are set to take a leading role in putting health data to work using AI, ML, and predictive analytics. You have access to significant data, control of working conditions and environment, and a trusted relationship with individuals.
Creating a culture that grooms healthier people, invites short-term and long-term advantages:
– increase health
– lower health costs
– improve employee retention
– increase productivity
Right now – use AI, ML, and predictive analytics to plan resources, build business continuity and forecast costs more accurately. Next, dig into rising risk groups. Identify actions that influence a more positive outcome. Work with vendors that embrace these technological opportunities – and ask them to articulate how their strategies drive savings for you, as a payor.
Choose a flexible analytics technology that will let you analyze results across different plans, evolve over time, and bring in point solution data.
Work with an established vendor whose core vision is in line with providing health analytics to employers, like yourself.
Health Big Data is complex. It requires highly specialized skill sets and domain expertise.

Reduce costs, improve health
Read about what the most strategic and innovative players doingto address rising costs as they design and manage benefits and plans in 2024.
Read Now

Read about key trends and what this means for employers.
Connecting trends to benefits strategies
Health care is changing quickly.
Read about the top 5 trends in health care and the analytics you can use to navigate plan design with confidence.
Read Now
Quantify them
Measure ROI
Understand connections
Connecting it all
Reverse delayed care habits

Read about key trends and what this means for employers.
Connecting trends to benefits strategies
SDoH analytics requires a lot of data, and different types of data. Claims data tells us about health care visits. Digital device data tells us about daily health. And special data sets let us delineate the social and environmental factors that could influence each member.
In SDoH analytics, we understand each person as an individual and in context, but look at a community as a whole in aggregate, to see what trends and patterns emerge.

Here are 5 important aspects to consider, and tips of what to look for, so you can trust the insights in your SDoH analytic endeavors.
Wellness means care and lifestyle choices. This data is scattered across many different places. Health analytics must integrate complex claims data structures and lifestyle data at an individual person level. SDoH analytics should also be connected at a person level. This way, the data is ready to serve all the analytic questions you may ask, without additional data preparation and delays.

The more granular a data set is, and assuming it is associated at a member-specific level, the more trustworthy and usable your SDoH insights will be. Think about the variation of social and environmental factors you see across an entire zip code. Now think about the degree of variation you see within a neighborhood. A Census Block Group is akin to a neighborhood. This means if you have source data that has a Census Block Group level of granularity, you are seeing only the degree of variation across neighborhoods, not entire zip codes.
Social and environmental factors cover a broad range of influences on health. Air quality or water quality? Economic hardship or transportation access? There is so much we can do if we have lots of different SDoH indices to choose from. For instance, one HDMS client is looing at the transporation index alongside the technology index to assess the potential usefulness and impact of a mobile unit verse a virtual solution for specific care services. Locations with low transporation AND low technology indices are prioritized for mobile services, while other locations are suitable for virtual care alternatives.

HDMS offers over 25 SDoH indices and dimensions.
Start with composite indices that allow you to look broadly across a number of factors at once. Use focused indices to support very specific or nuanced investigations, like food access or social isolation. They can also be used together – for instance the transportation index and the technology index example we shared above.
Have a good understanding of which social or environmental factor you are investigating and where that index is sourced. There are a wide variety of options. Nothing will be perfect. Some indices are more complete, more granular, more recently or frequently updated, than others. As you interpret results, have transparency around the process leading to the metrics. This will help everyone interpret and apply insights better in the long run.
TIP: Enriching claim data delivers fast and intuitive investigations. This makes SDoH analytics easier too.
Enrichment can have many forms: classify claims by episode treatment groups (ETG), apply pharmaceutical classifications, and flag specialty druges. Enrichment processing also identifies gaps in care and low value care and makes it easy to surface these individual moments into analytics.
ER visits that have been classified using the NYU methodology allow you to quickly look at who visited the ER for non-emergent care, just by using a few filters. Now think how powerful it is to further see these visits by income index.
As we think about integrating new data to investigate social determinants of health, we naturally focus on the new data – the addition. But we need to link that to core health data. Let’s not forget the quality and usability of those systems or sources. The data quality processes surrounding your traditional analytics are a critical part of trusted SDoH insights.

HDMS Enlight offers the most comprehensive out of the box SDoH analytics on the market.
Explore SDoH Analytics Contact us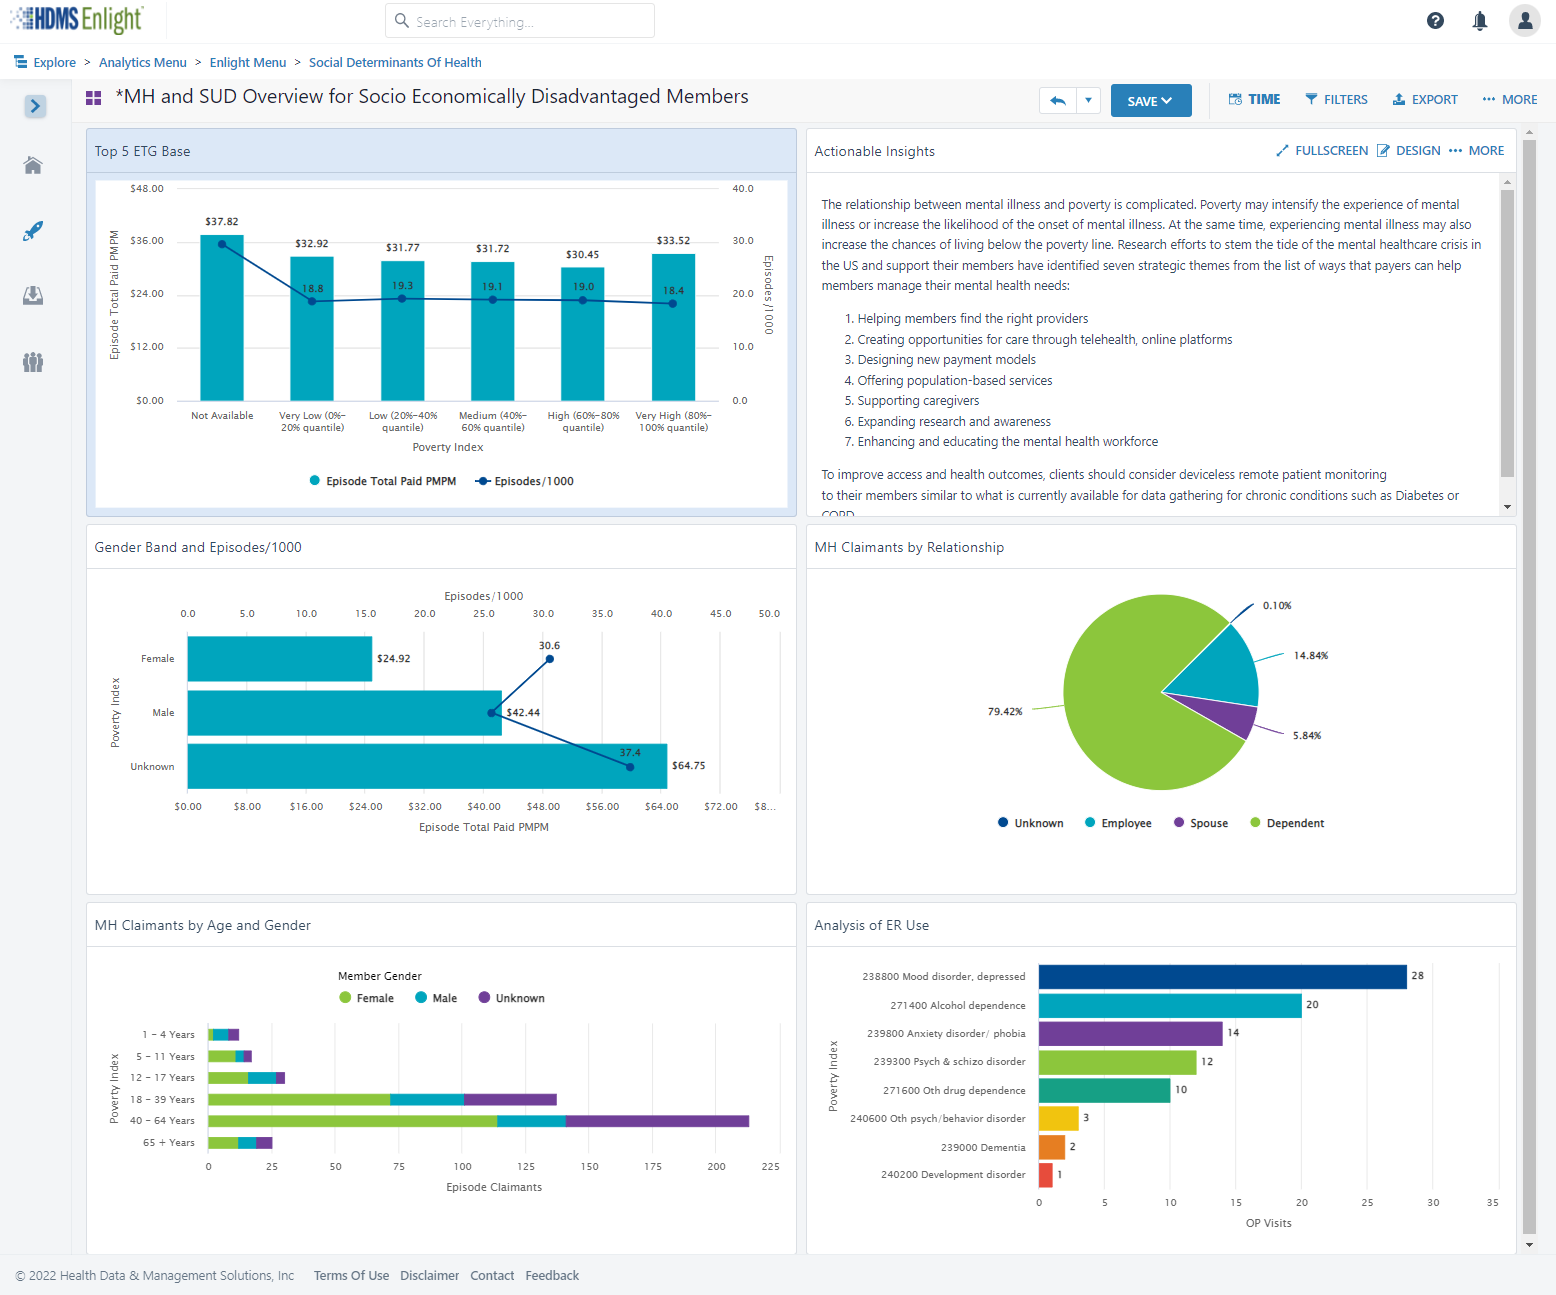
as part of health and wellness benefits.
Point solutions have been a great way to enhance benefits and provide care for a targeted need.
But as point solution costs add up, the pressure increases to understand, and sometimes PROVE, the value.

Most firms offer programs to identify health issues and manage chronic conditions (health risk assessments, biometric screenings, and health promotion programs).
83% of large firms offer a program in at least one of these areas: smoking cessation, weight management, and behavioral or lifestyle coaching.
Source: Kaiser Family Foundation study
Cohort comparisons are the ultimate analytic strategy for proving value. Without a direct comparison within the same population, there are so many factors that introduce doubt on what the numbers truly capture. Alternatively, by looking at well defined and specifically differentiated groupings of people, we can directly compare performance take away concrete and specific learnings.

Here’s a good example from our client base: This national retailer wanted to measure the value of a Center of Excellence strategy for heart conditions. The metric strategy compared a well-defined pair of cohorts that looked beyond traditional utilization and cost metrics. We helped them also include mortality rates (COE – lower), returns to work (COE – faster), outcomes (COE – better), and company satisfaction (COE – higher). Yes, that’s right – employees actually reported a higher employee satisfaction rate on the survey following a major episode of care.
Often “What’s the value?” is the wrong question. The correct question is “Who is this valuable for?” or “What’s the incremental value?”
There will always be a portion of a population that is engaged in their health and wellness. Your data can tell you who this population is, and provide insights that help you identify more people “like them” that you can target and pull along, therefore increasing program value. Also consider if the engaged audience would have been healthy or well without the special program, in some other way. Is it the program – or the people – that are providing the results you see?

Choice might be the right choice. The optimal strategy may not be selecting the best performing program in some cases. Use data to confirm if similar point solution programs are engaging the same or different audiences.
One self-funded employer had two somewhat similar wellness point solutions – Solution A emphasized “exercise and feel better.” Solution B emphasized “Eat right and feel better.” They both showed value – which one should they keep?
A deeper investigation of the data revealed that the solutions were in fact engaging somewhat different audiences. The self-funded plan sponsor found they increased the value of BOTH point solutions by understanding the demographic nuances, and creating more targeted communications and incentives that used these insights.

Don’t wait for results (e.g., traditionally after year 3 of data is collected and analyzed). Design metrics that act as leading indicators. After year 1, plan to optimize and performance tune. Move the conversation. Avoid “Wow – it looks like our MSK program had trouble engaging our guys in the warehouses even after 3 years,… should we look into a different solution or approach?” Prepare for, “Wow – it looks like our MSK program is having trouble engaging guys in the warehouses – what’s our plan to tackle this as we plan for year 2?”

Understand how social determinants of health influence engagement and utilization. Then optimize the point solution to meet broader needs by removing barriers. The data can show you where actions will be impactful.
Data that provides insights into social determinants of health can be time consuming to assemble into an analytic environment and then align to member health data. And yet it’s so powerful for insights. Your analysts time is better spent using this data as opposed to prepping it manually.
We evaluated medical and dental claims for diabetics after the introduction of a new Virtual PCP program. The solution was selected after seeing a statistically significant difference in PCP utilization across various household income segments. We created a specific scope around diabetics to study impacts on utilization, medication adherence, medical costs, and co-morbidities in mental health. Not all investigation can rely solely on data. The task force team worked with “Voice of the Member” groups, formed based on specific demographics. They focused on understanding context and color behind the numbers. Transportation, time away from work, and caregiving themes arose in the care access category. Other reasons were also presented, but offered less immediately actionable solutions.
With less time prepping data, the team had more time to dig deep, address quantified specific barriers, and is now measuring impact.
Check out how easy it is to include Social Determinants of Health (SDoH) factors into an analysis.
HDMS Enlight makes it easy to put these best practices to work.
Learn more Contact us for questions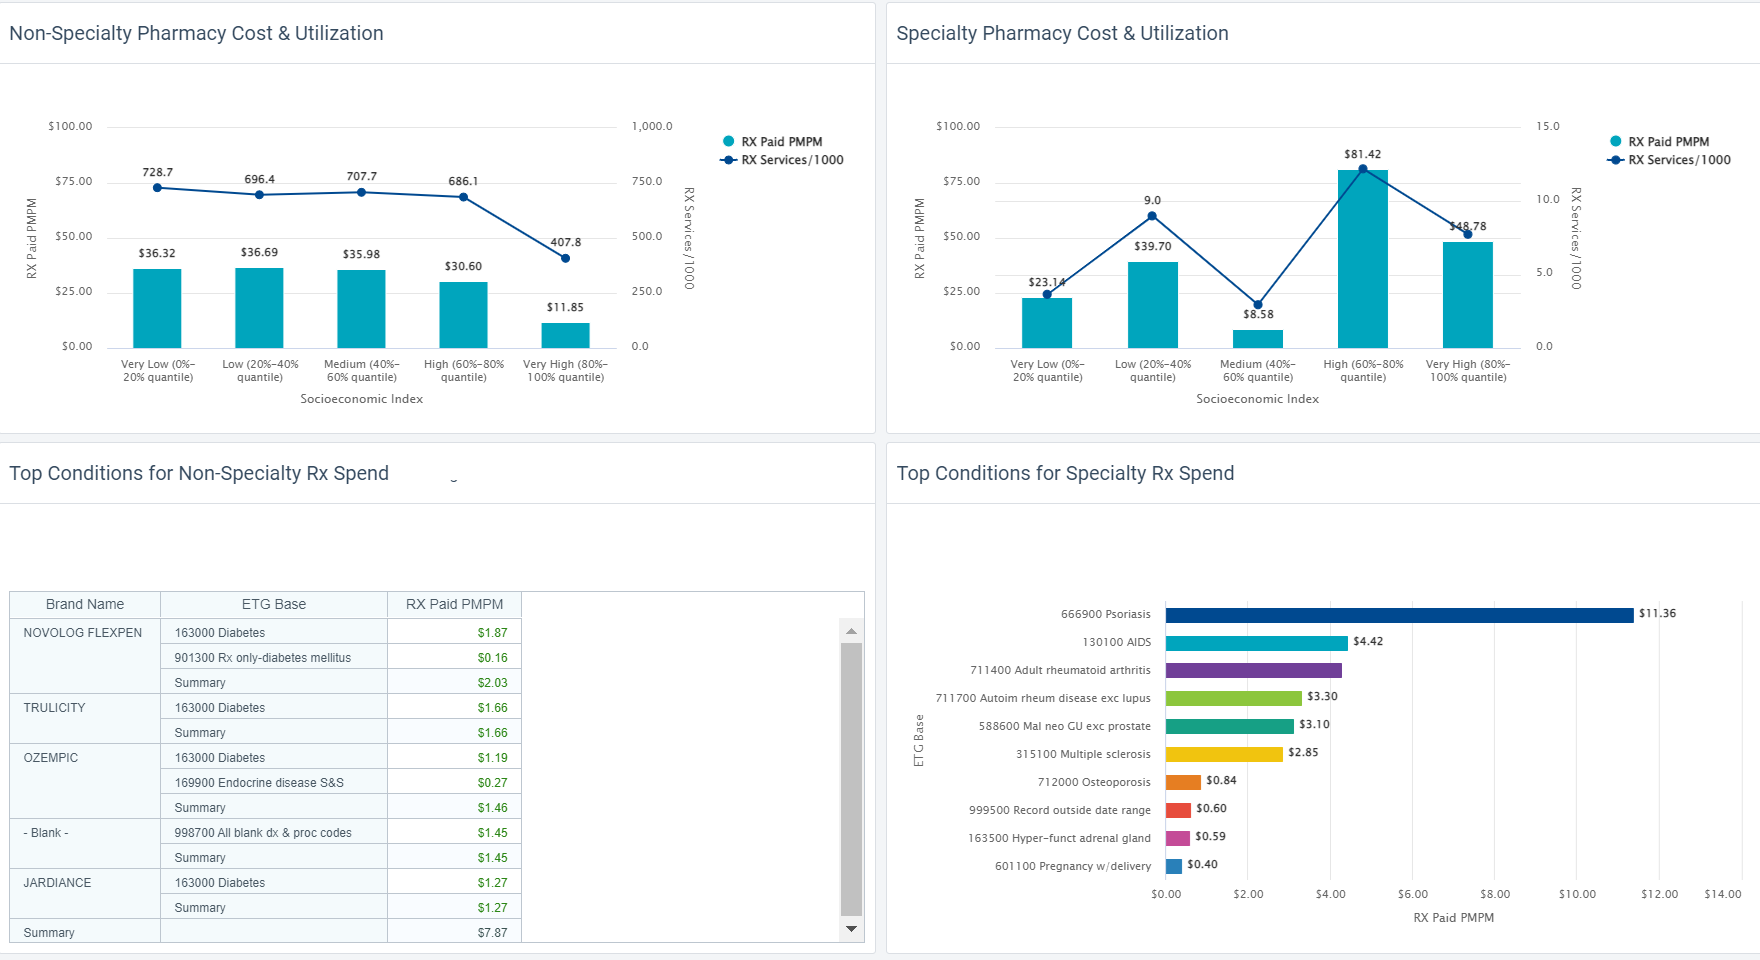
Article with keen insights shared by HDMS client experience leader, Jason Elliott, published in HR.com.
There are tremendous point solution programs out there.
With so many diverse needs and suspected equity gaps, where should investments be made? How does one start to show evidence of the true value delivered?
Learn from HDMS clients finding answers.
Just read below – we’ve copied the article to this page.
Read on HR.com
By Jason Elliott | September 9, 2022 Read time: 5 min
Any HR executive today will tell you how challenging the current environment is for attracting and retaining talent. According to the US Bureau of Labor Statistics, there were 11.2 million open job positions (vacancies) across the US at the end of Q2 2022. Hence, it stands to reason that organizations are rolling out the red carpet to try to appeal to job-seekers, offering sign-on bonuses as well as comprehensive health and financial benefits. Wellness rewards and a varied suite of ancillary health benefits have become the norm rather than the exception.
While the impact of these comprehensive ancillary benefits can be significant, so can the cost—especially since inflation is at a 40-year high. Therefore, data analytics are more vital now than in the past for driving decisions around the offering, expanding, or discontinuing various programs. The rise in the availability of new data enables nuanced and sophisticated analyses to determine the value of “total rewards” packages.
For years, the set of metrics used to measure the success of any health benefits program was limited to simple data elements available in standard claims. For example, the number of members who enrolled in a program, or the number of members who had one visit with a health care provider. Unfortunately, measurable health impacts usually do not occur immediately. Therefore, the success of a program cannot be determined immediately with any level of confidence.
However, enrollment metrics are no longer the only available barometer for engagement. The aggregation of traditional claims with non-traditional digital data sets now allows us to connect dots that were previously either invisible or inaccessible, thus revealing new trends and powerful insights.
The ability to identify how members engage with a certain program—and why—gives organizations the power to build programs around their employees’ real-life needs and make progress in delivering on the triple aim of reducing cost, improving health, and improving quality and experience. Questions commonly asked of our data analytics teams recently include:
Engagement in a program has been redefined. For example, rather than tracking just a daily step count in a fitness program, granular metrics like the frequency and intensity of biking, running, weight training, or even dancing are used in tandem with medical and pharmacy claims to identify discernible, meaningful, and quantifiable value.
Other examples of data types frequently leveraged from various solutions include biometrics (e.g., BMI, BP), lab tests (e.g., blood sugar, cholesterol, A1C, etc.), sleep patterns, meditation and mindfulness minutes, mood changes, dietary changes, etc.
It is possible to then look holistically at a program’s impact on employees’ health, wellbeing, productivity, quality of life, retention, disability avoidance, and other indicators—driving more effective benefits decisions.
The concept of coordinated and continuous care is not new, but clinical and digital transformation across the industry is now bringing us closer to achieving it. Understanding an individual’s interactions with care when they are healthy and not just when they are ill drives policy changes to reduce the burden of illness.
All programs offer something and will benefit some of the people in an organization. Often, the question is whether the magnitude of the benefit derived is enough to offset the cost of the program itself. This, in turn, drives decisions around expanding or discontinuing a solution.
One large employer, for instance, offered two separate wellness programs that promoted a healthy lifestyle with diet and exercise goals. However, one focused more on the exercise component while the other concentrated on healthy and mindful eating. When the employer tried to assess the effectiveness of both programs to determine if one added more value than the other overall, the data showed a very interesting and unique pattern. It revealed that adoption and engagement in the two solutions differed along racial, ethnic, and income lines. Different populations engaged with these solutions at similar levels for reasons outside of health status. As a result, the company decided to retain both programs since they obviously were essential to varied groups.
Likewise, mental well-being is now universally recognized as a critical part of overall health. Many organizations are compiling a profile of those who engage with their mental well-being solutions (e.g., EAP mental health programs) and evaluating their impact on employees’ medical comorbid conditions.
For one such organization, bringing together medical, pharmacy, and mental health EAP (digital) data brought to light an interesting link between anxiety and heart disease. Specifically, 30% of those with a new diagnosis of anxiety also had a new diagnosis of hypertension and/ or ischemic heart disease in the same year. They also sought care for other indicators of acute stress, such as flare-ups of autoimmune conditions. This insight helped the benefits team better align their concierge services to ensure a more holistic health model, where the mental, emotional, and physical health needs were addressed together.
Employers are also making major changes to benefit designs in a deliberate effort to remove barriers to care access, especially since the pandemic exposed the vulnerabilities of low-income and minority communities to weather major health storms.
As an example, several organizations have removed waiting periods (typically 30-90 days) for new employees to become eligible for health and financial benefits. Others have expanded paid sick time benefits for all workers, including hourly employees for whom paid sick time used to be rare. Some organizations that offer wellness rewards and incentives have done away with mandatory activities with incremental payouts.
Across health care, clinical and digital transformations are making it easier to analyze how people interact with health benefits—both mental and physical health, when sick and when well. Consequently, data also makes it possible to evaluate how the advantages of various programs differ for different subpopulations. When benefits are designed for total well-being, their value cannot be measured in silos—hence data analysts have become the new superheroes.

Vice President of Employer Customer Experiences
Health Data & Management Solutions (HDMS)
Jason Elliott is Vice President of Customer Experience for Employer clients at HDMS. A true public health enthusiast with a Masters in Epidemiology, he spent over a decade delivering dedicated clinical analytics and leadership at BCBS. Since then, Jason has managed the managed the Employer practice area. He brings very structured thinking into the types of problems his clients are trying to solve, and what can be done with the insights discovered.
Take a close look at how social determinants influence costs and utilization for your population.
How equitably do plans and networks meet diverse population needs?
Predictive models help you anticipate costs and identify ideal targets for specific actions.
See the value and impact of point solutions. How do they affect total costs and overall health?
Employers investing in wellness programs and point solutions, but the cost of the collection of programs is exacerbating inflated health care costs.
As decision-makers think about what to keep and where to reduce costs, the increasing amount of data available for insights is proving very worthy.
Read how HDMS recommends employers approach this – we’ve copied the article to this page. Just keep reading below.
Read on BenefitsPro Learn about Point Solution Analytics
By Rani Aravamudhan | July 28, 2022 at 10:15 AM
Published in Benefits Pro
Inflation is accelerating — not just gas and food prices, but also health care costs, and at much faster rates than years past. At the same time, employers are working hard to attract, care for and retain employees with relevant and comprehensive benefits.
Healthcare point solutions (e.g., diabetes or blood pressure management solutions, fitness apps, etc.) have exploded in popularity as part of healthcare benefits, but they also cost a pretty penny. Hence data analytics prove to be vital now (more than in the past) in driving decisions around offering, expanding, or discontinuing various ancillary benefit programs. The rise in the availability of new data types from these solutions enable nuanced and sophisticated analyses to determine the value of the whole benefits or “total rewards” packages as they are dubbed.
For years, the set of metrics used to measure the success of any program was limited to simple data elements available in standard claims – the number of members that enrolled in a program or the number of members that had one visit with a provider. Enrollment metrics are no longer the only available barometer for engagement. For instance, the aggregation of traditional claims with non-traditional digital data sets allows for connection of dots that were previously invisible or had no access, thus revealing new trends and powerful insights.
Engagement In a program has thus been redefined. Rather than tracking how many people enroll in a certain wellness or fitness program, granular metrics like the frequency of use of apps or numbers of digital visits with clinicians are used in tandem with medical and pharmacy claims to identify discernible, meaningful, and quantifiable value. Other examples of data types frequently leveraged from various solutions include biometrics (e.g., BMI, BP), lab tests (e.g., blood sugar, cholesterol, A1C, etc.), sleep patterns, meditation and mindfulness minutes, mood changes, dietary changes, etc. It is possible to then look holistically at a program’s impact on employees’ health, wellbeing, productivity, quality of life, and other indicators — driving more effective benefits decisions.
The concept of coordinated and continuous care is not new, but clinical and digital transformation across the industry is now bringing us closer to achieving it. Understanding an individual’s interactions with care when they are healthy and not just when they are ill drives policy changes to reduce the sick times.
The ability to identify who is, or is not, engaging with a certain program — and why — gives organizations the power to build programs around their employees’ real-life needs. Questions commonly asked of our data analytics teams include:
A few case studies illustrate how data is impacting employer healthcare decision-making:
In the second case study, one large employer offered two separate wellness programs that promoted a healthy lifestyle with diet and exercise goals. However, one focused more on the exercise component while the other concentrated on healthy and mindful eating. When they tried to assess the effectiveness of both (to determine if one added more value than the other overall), the data showed a very interesting and unique pattern. Adoption and engagement in the two solutions differed along racial, ethnic and income lines. Different populations engaged with these solutions likely for reasons outside of health status. As a result, the company decided to retain both programs since they obviously were essential to varied groups.
For one such organization, bringing together medical, pharmacy and mental health EAP (digital) data brought to light an interesting link between anxiety and heart disease. Specifically, 30% of those with a new diagnosis of anxiety also had a new diagnosis of hypertension and/ or ischemic heart disease in the same year. They also had sought care for other indicators for acute stress. This insight helped the benefits team better align their concierge services to ensure a more holistic health model, where the mental and physical health needs were addressed together.
Health benefits are far too expensive and important to select based on partial insights or guesswork. Thankfully, the days of using proxy indicators to measure success are over. The growing convergence of digital and traditional data allows organizations to evaluate programs in the context of real value to support their most valuable resource — their employees.

Head of Clinical Advisory Services at HDMS.
Dr. Rani is a general medicine physician who cares for individuals yet connects experiences to population health perspectives using deep data expertise. Rani is known for her work in data-driven transformation, workflow design and development, value-based care, risk management and clinical quality and performance reporting. Her work and team guides clients to understand what is possible with data, find answers and insights within projects and analyses, and build context and scale across HDMS clients.
Why rely solely on metrics like number of enrolled? Don’t you want to quantify health outcomes?
Are you successfully engaging individuals who would most benefit? Or are only those who are already highly engaged in their health?
Achieving maximum ROI from wellness programs comes from changing behaviors. Who is most at-risk for adverse health events and consequently would benefit the most from an initiative? How can data help?
Read this article from BenefitsPro. It shares how HDMS recommends employers approach this – we’ve copied the article below.
Read on BenefitsPro
Wellness programs have become a staple of employer benefits offerings. According to one KFF trends report, nearly 9 in 10 employers with a workforce of 200 or more offered some sort of workplace wellness initiative in 2019.
While many employers are willing to invest in wellness programs—which often are offered through third-party vendors—they aren’t always clear on the goals for these benefits. Multiple surveys and studies across the industry attest to this. No clear goals mean no systematic approach to defining and consequently measuring ROIs.
Most employers rely on wellness vendors’ claims about the potential to improve health outcomes and reduce health care costs. They do not necessarily have the means and/ or expertise to independently verify the proposed advantages either prior to or after implementing them.
Metrics used by vendors to illustrate their successes are not always applicable to all populations or groups. For instance, let’s say a vendor’s “expected outcomes” include a 20% increase in smoking cessation rates. Is that 20% over three months or over three years since the last smoking incident? Or, is it based on a one-time pledge by the participant? What was the size of the overall smoker population in their sample data? Then there is always the question, “Is that the right metric for your population?”
Data analytics can provide objective insights to evaluate such partnerships before beginning, renewing or expanding a wellness program.
Like any strategic endeavor, effective ROI measurement requires diligent groundwork before actual data analysis can begin. It is essential to ensure that the right metrics are chosen for measurement of “before” and “after” states.
Concrete objectives will vary by employer as well as by program—but beware of setting goals focused solely on short-term “dollars-in” vs. “dollars-out.” An effective wellness program aimed at promoting better rates of preventive care with active engagement may actually increase expenses in the immediate and short term. In such cases, the true long-term objective should be to shift health care services from unpredictable, high-cost settings like the emergency department (ED) to more predictable, lower-cost settings like primary care physicians’ offices.
Today’s wellness programs tend to be more holistic in their approach to employee health than the offerings of just a few years ago. Many employers are looking for more than isolated reductions in smoking rates or ED visits. They are starting to understand the overall health and financial benefits to their businesses possible through programs that integrate physical health with mental health and well-being. This adds obvious layers and complexity to the ROI conversation.
Preparing for any ROI measurement requires assessing all the data sources at your disposal. It’s critical to obtain as close to a 360-degree view of the entire employee population as possible, which typically requires melding multiple disparate data sources. Medical and pharmacy claims, lab values, biometric and clinical data from electronic health records (EHRs) are some examples. Data warehousing and analytics solutions can help this process by aggregating, integrating, enriching and normalizing data along with consultative services to provide the right insights.
Finally, a realistic timeframe for measuring program outcomes is a must, especially when claims are part of equation, to allow for the time lag between services rendered and paid out. Hence 12 to 18 months serves as an optimal window to gauge discernible changes to patterns of care experience and member behavior. That said, periodic measurements throughout this time are essential for tweaking and adjusting workflows and processes to ensure proper data aggregation (e.g. presence of required code sets, uniform cadence in receipt of various data types, etc.).
Achieving maximum ROI from wellness programs comes from changing behaviors, especially of those who are most at risk for adverse health events and consequently would benefit the most from these initiatives. For example, employees with chronic conditions who struggle with medication adherence or with managing stress due to work and family obligations. Promoting and maintaining engagement in such groups is challenging, but key to the success of the program itself.
On the same token, initial engagement tends to be high among members who are healthier and would likely gain little from a wellness or similar program, especially when there are participation incentives involved. Engagement typically tends to decline once the incentive requirements are met or phased out.
Setting up cohorts of participants with these factors in mind is critical because the metrics chosen to measure success levels in each will vary. Leveraging the expertise of data analytics vendors and consultants to define and set up such study cohorts—with and without comparable controls—goes a long way in these endeavors.
For example, employees who are engaged in wellness programs tend to also take advantage of preventive services and have a primary care provider. Consequently, data typically will show that they have higher rates of primary care and in-network utilization—whereas those who don’t participate have more ED and out-of-network services.
t is vital to ask the question, “Are we measuring the right things for each cohort for this particular initiative?” Defining the right metrics for a cohort is therefore an important aspect of the study design. Example: Establishing new primary care provider relationships and closing care gaps would be good metrics for employees who have traditionally not sought regular primary care in the past. On the other hand, keeping pertinent lab or biometric values within normal ranges, or garnering low scores on health risk assessment tools may be better suited for healthier and more engaged populations. Establishing clear baselines for each metric on day 0 is imperative for apples-to-apples comparisons.
Many employers are using non-traditional data sources to track metrics like sick time, other leave utilization, and rates of disability claims to evaluate the effectiveness of a wellness program. Data analytics and warehousing vendors offer tremendous advantages in this area by integrating disparate data sources.
Pilot programs for a carefully chosen group with comparative control groups is always recommended, especially for new wellness initiatives. In addition to ironing out administrative and process challenges, they provide a great means of gauging the operational effort and resources required. This is an often-overlooked expense not featured in ROI calculations.
Results from a pilot program can go a long way toward determining an effective roll-out strategy. It’s essential to compare these results against the total employee population for the same timeframe. Example: An increase in the rates of flu vaccine compliance among employees in a pilot group does not mean much if vaccine compliance also increased in the total employee population due to onsite flu clinics. With successful pilots that show a definite improvement in outcomes for the participants, odds of further success are better when the program is expanded to demographically similar employees.
The last few months have brought renewed focus on the overall well-being of the workforce. Employers recognize the importance of the physical, mental and emotional wellness of their employees and their families. It’s not surprising that wellness program vendors, especially those that provide integrated services, are popular.
But rather than jumping on the wellness bandwagon or adding a program just to expand the suite of benefits, employers would be better served to make data-driven decisions. They would do well to engage the many data analytics vendors who provide evaluation services to answer key questions. “Is this right for our company?” and “Will this save me money on health care costs?” are the types of questions that can be answered even before the program is implemented, based on existing statistics or sample data sets.
Dr. Rani is Head of Clinical Advisory Services at HDMS. She is a physician (specialty – General Medicine) with extensive experience in the EMR/EHR and population health industries with a focus on clinical transformation, workflow design and development, value-based care, risk management and clinical quality and performance reporting. Her strong background in clinical medicine and experience in the HIT industry make her successful in navigating payer, provider and technology vendor landscapes.
Why rely solely on metrics like number of enrolled? Don’t you want to quantify health outcomes?
Published in HR Executive
Authored by Rani Aravamudhan, Senior Clinical Consultant, HDMS
HR executives have followed the time-tested adage of past behavior being the best predictor of future behavior – evaluating utilization patterns over time to make educated projections for the upcoming year. However, given the skewed healthcare consumption caused by COVID-19, these traditional means of assessing year over year trends fall predictably short.
Read the five strategies suggested to guide effective benefit design.

Maybe they act upon facts and share these openly with you?
Even when it’s not great news?
While everyone works to meet Transparency in Coverage regulations, we see the chance for you to leap ahead. Anticipate where the market is going and offer more than traditional plan sponsor reporting – bring your plan sponsors business transparency, strategic plan performance transparency. You’ll earn their trust; you’ll be rewarded with retention.
With major industry changes, new care options, and changes in care needs, people have lots of new questions. Be the health plan that easily gives plan sponsors answers, even to hard questions.
Employers benefit because health benefit satsifaction is a contributing factor to employee retention. With the right analytics, it can be easy to find opportunities to improve, maybe by introducing additional plan options. Yes, that’s right. Design analytics that introduce the potential value of your buy-ups. With better plan performance everyone wins as health care costs lower overall.
In an industry built upon trust,
Embrace it, lead with trust

Increase plan sponsor trust with an analytic strategy that delivers better plan transparency, too.
You’ll deepen relationships, earn loyalty, and retain your customers.
What could controlled plan sponsor plan performance transparency look like?
Self-service analytic front-ends are what people want, to explore data. But the secret is the data itself. If you want to focus on using data for plan performance improvements, your analytic views will naturally be very specific to your business.
Take a peek at HDMS Enlight™. Imagine plan sponsors with access to data and analytics you choose or design. See teams working side by side with accounts, helping them to optimize and get the most out of your thoughtfully designed plans and networks.
(yet verify – it’s ok, we would too.)