as part of health and wellness benefits.
Point solutions have been a great way to enhance benefits and provide care for a targeted need.
But as point solution costs add up, the pressure increases to understand, and sometimes PROVE, the value.

Most firms offer programs to identify health issues and manage chronic conditions (health risk assessments, biometric screenings, and health promotion programs).
83% of large firms offer a program in at least one of these areas: smoking cessation, weight management, and behavioral or lifestyle coaching.
Source: Kaiser Family Foundation study

Cohort comparisons are the ultimate analytic strategy for proving value. Without a direct comparison within the same population, there are so many factors that introduce doubt on what the numbers truly capture. Alternatively, by looking at well defined and specifically differentiated groupings of people, we can directly compare performance take away concrete and specific learnings.

Here’s a good example from our client base: This national retailer wanted to measure the value of a Center of Excellence strategy for heart conditions. The metric strategy compared a well-defined pair of cohorts that looked beyond traditional utilization and cost metrics. We helped them also include mortality rates (COE – lower), returns to work (COE – faster), outcomes (COE – better), and company satisfaction (COE – higher). Yes, that’s right – employees actually reported a higher employee satisfaction rate on the survey following a major episode of care.
Often “What’s the value?” is the wrong question. The correct question is “Who is this valuable for?” or “What’s the incremental value?”
There will always be a portion of a population that is engaged in their health and wellness. Your data can tell you who this population is, and provide insights that help you identify more people “like them” that you can target and pull along, therefore increasing program value. Also consider if the engaged audience would have been healthy or well without the special program, in some other way. Is it the program – or the people – that are providing the results you see?

Choice might be the right choice. The optimal strategy may not be selecting the best performing program in some cases. Use data to confirm if similar point solution programs are engaging the same or different audiences.
One self-funded employer had two somewhat similar wellness point solutions – Solution A emphasized “exercise and feel better.” Solution B emphasized “Eat right and feel better.” They both showed value – which one should they keep?
A deeper investigation of the data revealed that the solutions were in fact engaging somewhat different audiences. The self-funded plan sponsor found they increased the value of BOTH point solutions by understanding the demographic nuances, and creating more targeted communications and incentives that used these insights.

Don’t wait for results (e.g., traditionally after year 3 of data is collected and analyzed). Design metrics that act as leading indicators. After year 1, plan to optimize and performance tune. Move the conversation. Avoid “Wow – it looks like our MSK program had trouble engaging our guys in the warehouses even after 3 years,… should we look into a different solution or approach?” Prepare for, “Wow – it looks like our MSK program is having trouble engaging guys in the warehouses – what’s our plan to tackle this as we plan for year 2?”

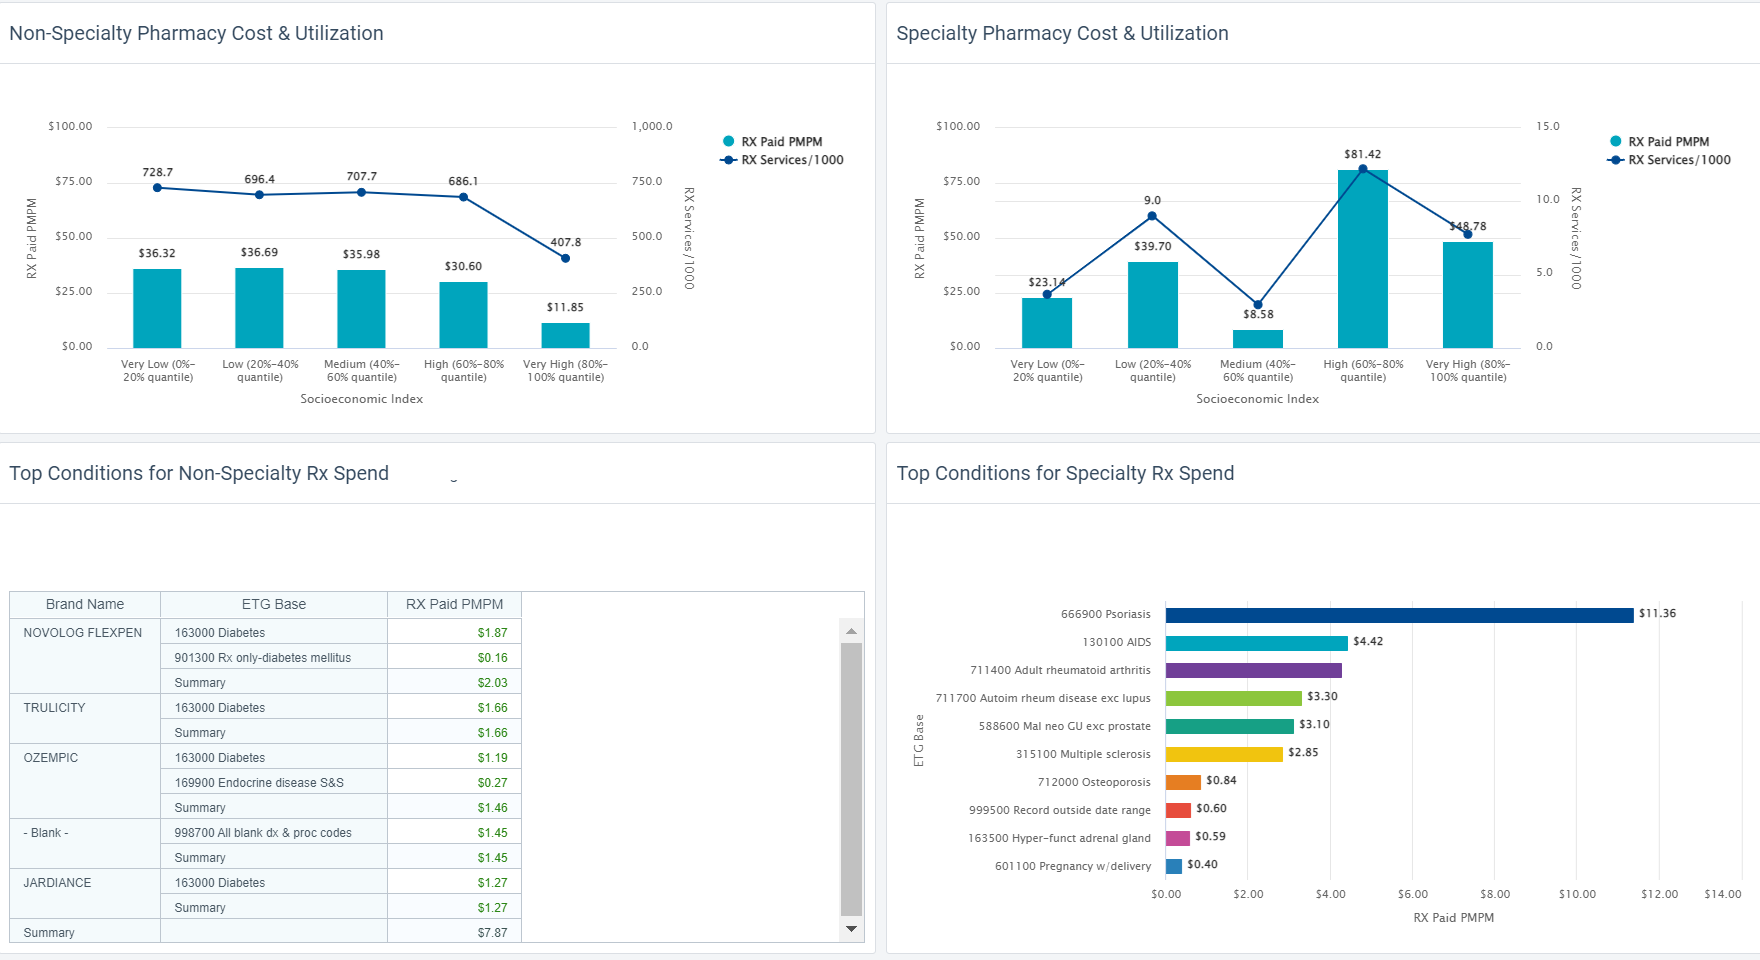
Understand how social determinants of health influence engagement and utilization. Then optimize the point solution to meet broader needs by removing barriers. The data can show you where actions will be impactful.

Data that provides insights into social determinants of health can be time consuming to assemble into an analytic environment and then align to member health data. And yet it’s so powerful for insights. Your analysts time is better spent using this data as opposed to prepping it manually.
We evaluated medical and dental claims for diabetics after the introduction of a new Virtual PCP program. The solution was selected after seeing a statistically significant difference in PCP utilization across various household income segments. We created a specific scope around diabetics to study impacts on utilization, medication adherence, medical costs, and co-morbidities in mental health. Not all investigation can rely solely on data. The task force team worked with “Voice of the Member” groups, formed based on specific demographics. They focused on understanding context and color behind the numbers. Transportation, time away from work, and caregiving themes arose in the care access category. Other reasons were also presented, but offered less immediately actionable solutions.
With less time prepping data, the team had more time to dig deep, address quantified specific barriers, and is now measuring impact.
Check out how easy it is to include Social Determinants of Health (SDoH) factors into an analysis.
HDMS Enlight makes it easy to put these best practices to work.
Learn more Contact us for questions