Start with a high-level understanding of what parts of healthcare spend are driving trends within a specific organization or book of business.
Learn more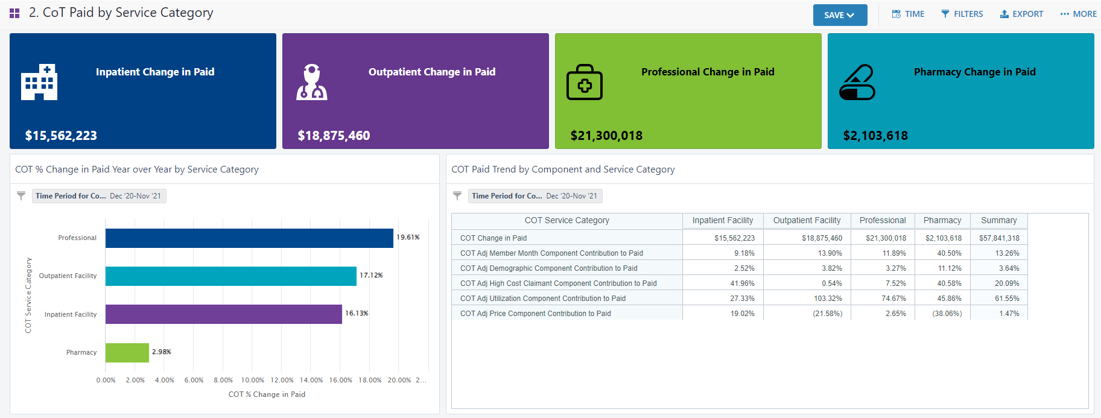
Measure impact before guidelines become policy
New recommendations for Breast cancer screening emerged in March 2023. The U.S. Preventive Services Task Force (USPSTF) recommends mammograms every 2 years for women starting at age 40. You can assess the impact of this change before these guidelines are formalized into policies.
See how health data can tell you:
See insights from this study on an employed population.
Read the study
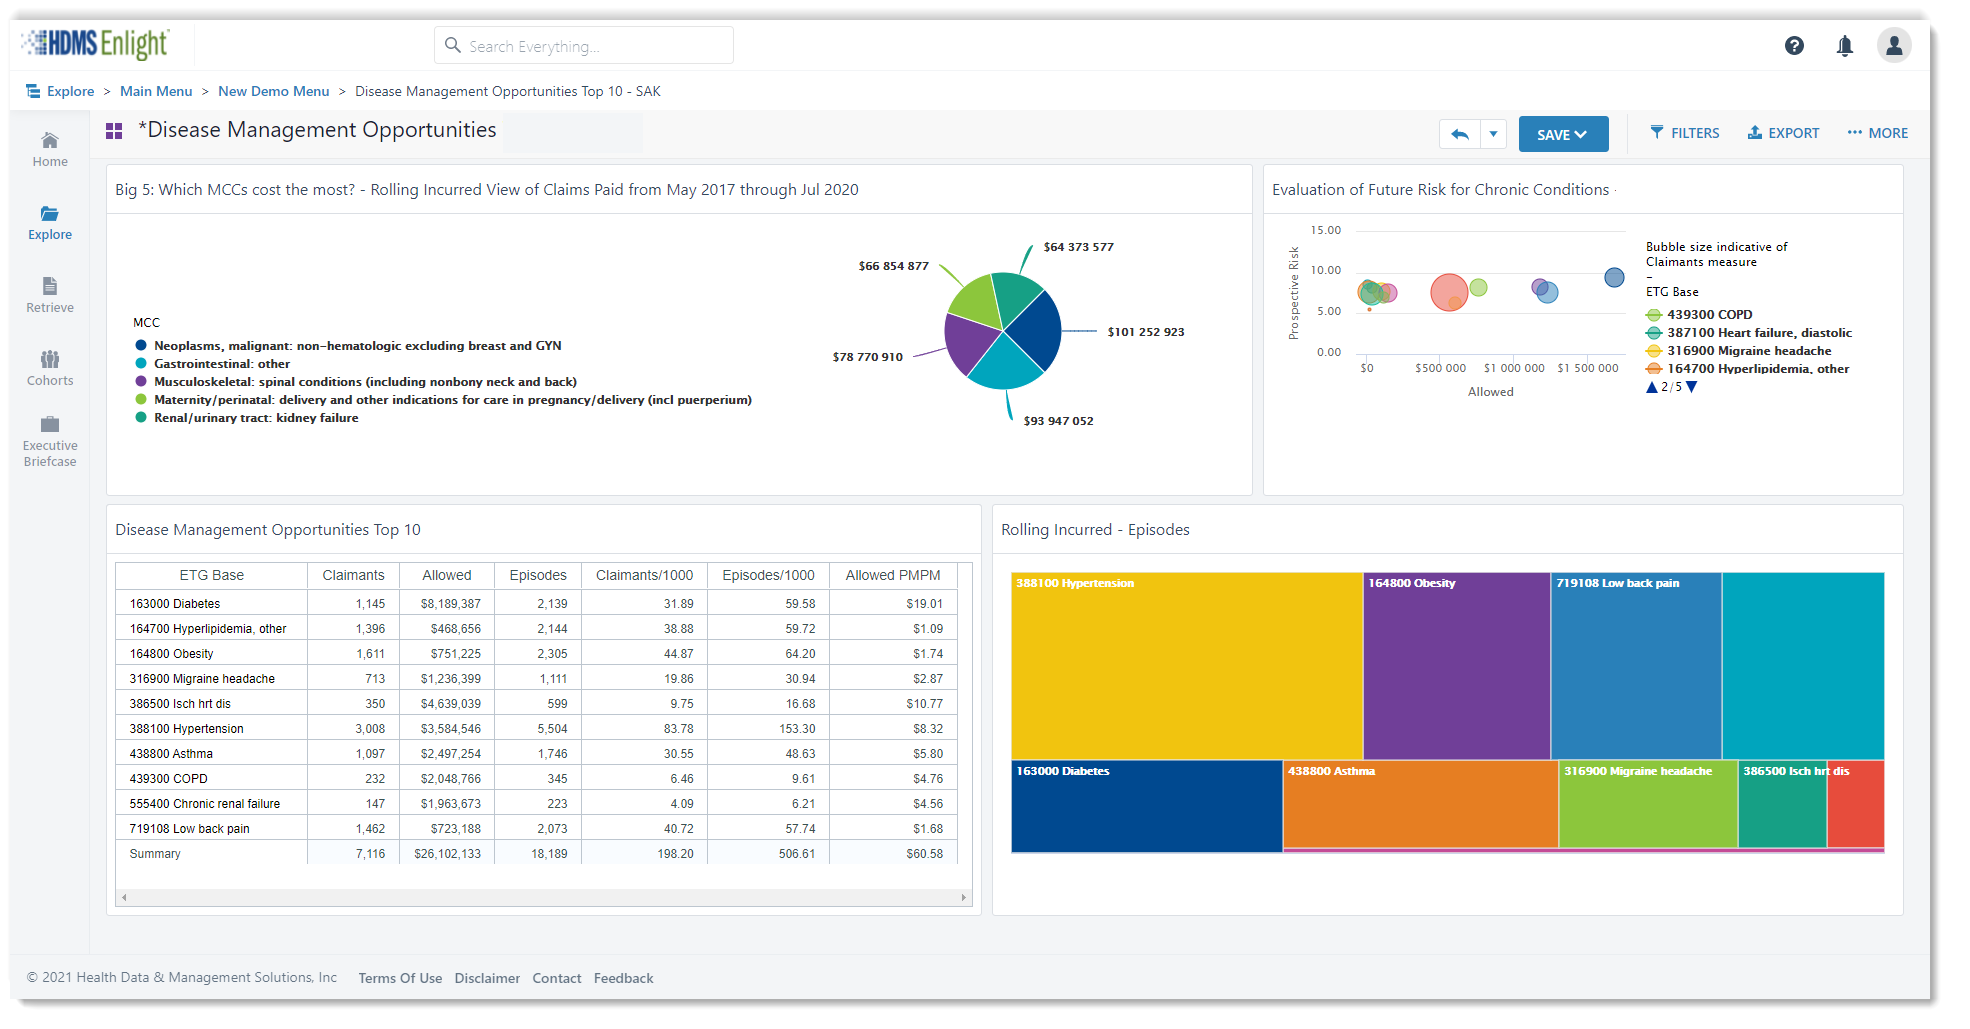
Unhealthy populations increase costs now and in the future. Breaking down barriers to underutilization of preventative care services and regular PCP visits is a fundamental tool for cost management.
Digging into social determinants of health reveals new insights into which parts of your population may be underutilizing care more significantly than others. This helps identify and then break down barriers. Prioritize where you focus innovation.
Here are some interesting insights recently shared at an innovation conference and luncheon roundtable.
Learn more
Ozempic has made headlines recently, for trending off-label uses.
HDMS Analytics Practice digs into a data set using new analytic content. See emerging trend insights that surprised our team.
Read now
HDMS provides predicitive models, pre-defined segments, model scores, historical predictions and more.
Bring member-level scores and cohorts into a cross-prediction analytic view.
There’s power and sophistication wrapped up in an intuitive user experience – so you can do more than look back on historical trends.
Learn more
HDMS clients – have your team walk you through the latest models.
What do you do next? We’ll make sure your data supports your next steps and actions.
Review an analytic framework and methodology for analyzing abortion health care services.
Ask your team if you are interested in additional analytics surrounding abortion services. We will make sure you have access to the types of metrics and dashboards that best support your business questions and benefits strategy.
Get more details
– HDMS client
The supreme court ruling overturning Roe vs. Wade resulted in HR teams all across the country assessing impact and planning for shifts in member benefits both short and long term.
As legislation continues to evolve at the state level, changes, employers naturally wish to review in depth how it is impacting their workforce and benefits offerings.
Read specifics around the analytics available to provide relevant facts for informed decisions and quantified planning.
Get the Spotlight
Easy access to answers.
Even when the questions change.
Use Analytics to dig into specific parts of your population and better understand unique health concerns, emerging needs, and guide decisions for a more thoughtful benefits strategy.
HDMS clients have access to Transgender Health dashboards.
Look at some of the insights that clients may find.
Get the SpotlightHDMS clients – have your team walk you through your dashboards. Where can you take this next? We’ll help tailor and expand this for you!
This year, you’ve adjusted the physical working environments in your offices, manufacturing plants, and retail floors. You’ve adopted the state, local, and CDC guidance with your own new policies for COVID-19. You’re even offering free flu shots on-site for your employees.
Wondering what else you can do to support your essential workers? By analyzing a few key metrics, you can make decisions that support employee health and productivity—now, and into the future.
Get the guide
The COVID-19 Cost Model built by HDMS is used and adapted to meet our client’s needs and interests. We invite you to download this model and use as-is – or customize it to suit your specific needs.
Read on for a few tips to get the most out of your COVID-19 cost model:
Get the COVID-19 cost model
Use a cross-functional approach: Obtain representation and contribution from across the organization, with inputs from Finance, Data, and Clinical/ Healthcare Specialist resources, at a minimum. Clinical/Healthcare Specialists ensure your model is answering key questions, contains accurate assumptions, and reflects current thinking. Your data team, working in collaboration will create efficiencies in balancing what you want to know and what data is available to support this investigation. They can help build for a refreshable model and possibly introduce new ideas to the team based on data possibilities. The finance team will guide calculation accuracy and are usually great partners to help with organizational buy-in and create confidence in the model.
Build for ranges: Create a model framework that invites ranges both as inputs and outputs. The template provided contains both range estimates and is constructed for three case scenarios to help accommodate different organizational approaches. This increases the usability of the model, as ranges communicate a realistic spectrum. By understanding how large the range can be, you innately create context for anyone using the model outputs.
Create in parallel: Again, collaboration is key. Let data analysis help inform increasing specificity for your cost model. As you develop your model, assess the data available to support increased granularity and actionability. Bring in member demographics like age, gender, geography and use historical health insights along with HR data to consider health risks, role type and job type considerations. Health plans might also wish to analyze by industry, geography, plan type, or other business attributes for additional aggregated insights.
Build assumptions as variables: What we know is rapidly changing and evolving. By building assumptions in as variables, rather than use within formulas, you can update your assumptions more easily and completely. Showing the values as variables on the model itself also creates transparency so it is clear what is used in calculations.
Make the model self-documenting: Document within the model itself. Cite and link to sources, show assumptions as variables as shared above, and create a high level of transparency to help answer as many questions as possible. Make it easy to check sources to see if recommendations or assumptions merit updating based on evolving information.
Download the HDMS COVID-19 Cost Model to see and play with a working model. If you are an HDMS client, reach out to your customer experience team for a more detailed and customizable model that works cohesively with your HDMS implementation.